Lithuanian vs Immigrants from Ireland Married-Couple Family Poverty
COMPARE
Lithuanian
Immigrants from Ireland
Married-Couple Family Poverty
Married-Couple Family Poverty Comparison
Lithuanians
Immigrants from Ireland
4.0%
MARRIED-COUPLE FAMILY POVERTY
100.0/ 100
METRIC RATING
11th/ 347
METRIC RANK
4.1%
MARRIED-COUPLE FAMILY POVERTY
99.9/ 100
METRIC RATING
19th/ 347
METRIC RANK
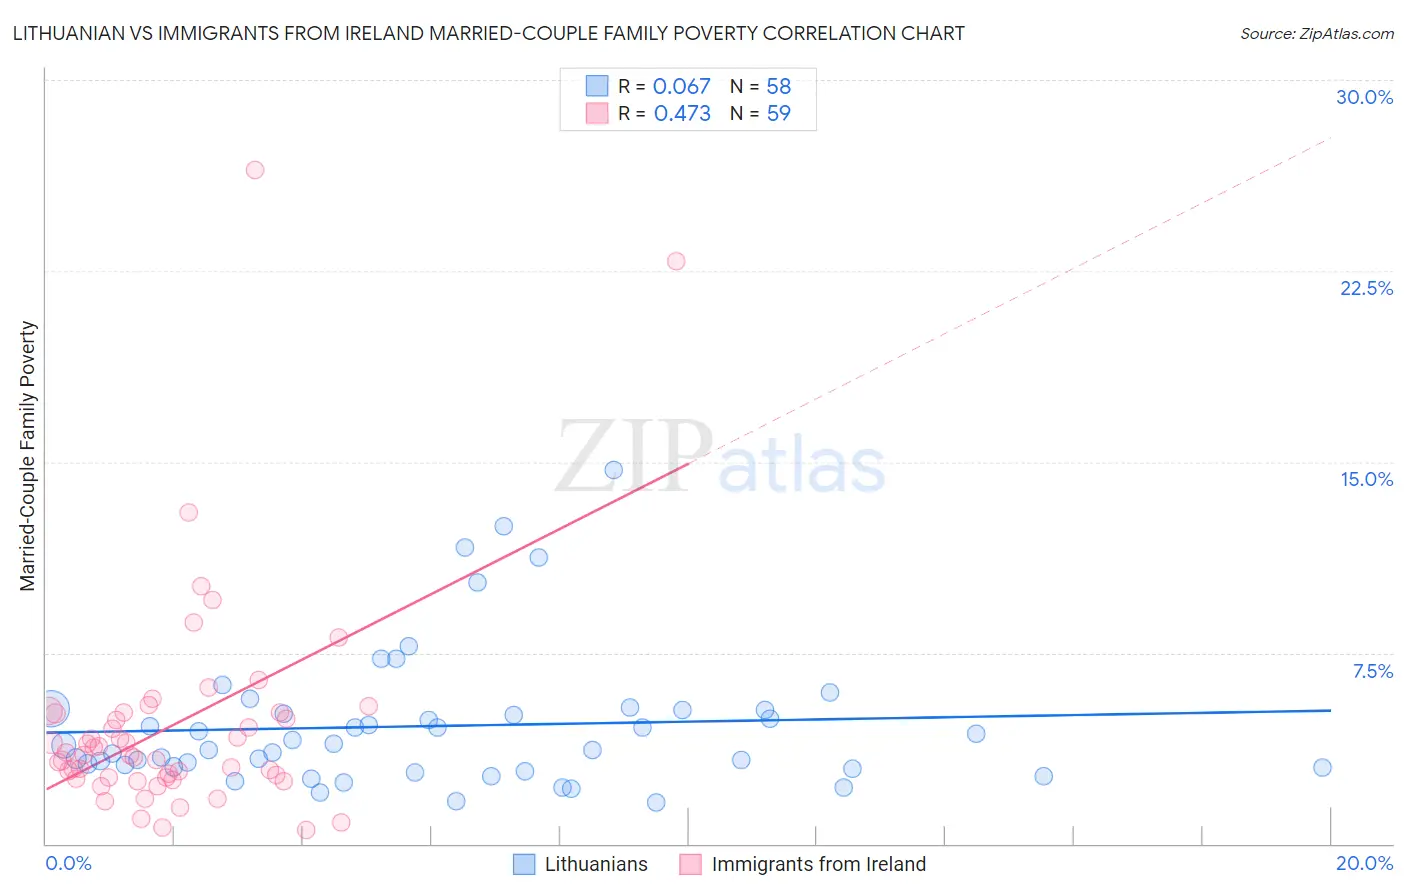
Lithuanian vs Immigrants from Ireland Married-Couple Family Poverty Correlation Chart
The statistical analysis conducted on geographies consisting of 416,141,863 people shows a slight positive correlation between the proportion of Lithuanians and poverty level among married-couple families in the United States with a correlation coefficient (R) of 0.067 and weighted average of 4.0%. Similarly, the statistical analysis conducted on geographies consisting of 239,104,626 people shows a moderate positive correlation between the proportion of Immigrants from Ireland and poverty level among married-couple families in the United States with a correlation coefficient (R) of 0.473 and weighted average of 4.1%, a difference of 2.8%.
Married-Couple Family Poverty Correlation Summary
| Measurement | Lithuanian | Immigrants from Ireland |
| Minimum | 1.6% | 0.56% |
| Maximum | 14.7% | 26.5% |
| Range | 13.1% | 25.9% |
| Mean | 4.6% | 4.7% |
| Median | 3.8% | 3.5% |
| Interquartile 25% (IQ1) | 3.0% | 2.6% |
| Interquartile 75% (IQ3) | 5.3% | 5.1% |
| Interquartile Range (IQR) | 2.3% | 2.5% |
| Standard Deviation (Sample) | 2.7% | 4.4% |
| Standard Deviation (Population) | 2.7% | 4.4% |
Demographics Similar to Lithuanians and Immigrants from Ireland by Married-Couple Family Poverty
In terms of married-couple family poverty, the demographic groups most similar to Lithuanians are Carpatho Rusyn (3.9%, a difference of 0.51%), Croatian (3.9%, a difference of 0.56%), Bulgarian (4.0%, a difference of 0.70%), Thai (3.9%, a difference of 1.0%), and Latvian (3.9%, a difference of 1.5%). Similarly, the demographic groups most similar to Immigrants from Ireland are Maltese (4.1%, a difference of 0.25%), Zimbabwean (4.1%, a difference of 0.27%), Immigrants from Singapore (4.1%, a difference of 0.64%), Bhutanese (4.1%, a difference of 0.66%), and Italian (4.0%, a difference of 0.78%).
| Demographics | Rating | Rank | Married-Couple Family Poverty |
| Swedes | 100.0 /100 | #5 | Exceptional 3.9% |
| Luxembourgers | 100.0 /100 | #6 | Exceptional 3.9% |
| Latvians | 100.0 /100 | #7 | Exceptional 3.9% |
| Thais | 100.0 /100 | #8 | Exceptional 3.9% |
| Croatians | 100.0 /100 | #9 | Exceptional 3.9% |
| Carpatho Rusyns | 100.0 /100 | #10 | Exceptional 3.9% |
| Lithuanians | 100.0 /100 | #11 | Exceptional 4.0% |
| Bulgarians | 100.0 /100 | #12 | Exceptional 4.0% |
| Czechs | 100.0 /100 | #13 | Exceptional 4.0% |
| Slovaks | 100.0 /100 | #14 | Exceptional 4.0% |
| Poles | 100.0 /100 | #15 | Exceptional 4.0% |
| Germans | 100.0 /100 | #16 | Exceptional 4.0% |
| Filipinos | 100.0 /100 | #17 | Exceptional 4.0% |
| Italians | 100.0 /100 | #18 | Exceptional 4.0% |
| Immigrants | Ireland | 99.9 /100 | #19 | Exceptional 4.1% |
| Maltese | 99.9 /100 | #20 | Exceptional 4.1% |
| Zimbabweans | 99.9 /100 | #21 | Exceptional 4.1% |
| Immigrants | Singapore | 99.9 /100 | #22 | Exceptional 4.1% |
| Bhutanese | 99.9 /100 | #23 | Exceptional 4.1% |
| Eastern Europeans | 99.9 /100 | #24 | Exceptional 4.1% |
| Immigrants | Taiwan | 99.9 /100 | #25 | Exceptional 4.1% |