Lithuanian vs Immigrants from Korea Married-Couple Family Poverty
COMPARE
Lithuanian
Immigrants from Korea
Married-Couple Family Poverty
Married-Couple Family Poverty Comparison
Lithuanians
Immigrants from Korea
4.0%
MARRIED-COUPLE FAMILY POVERTY
100.0/ 100
METRIC RATING
11th/ 347
METRIC RANK
4.5%
MARRIED-COUPLE FAMILY POVERTY
99.4/ 100
METRIC RATING
70th/ 347
METRIC RANK
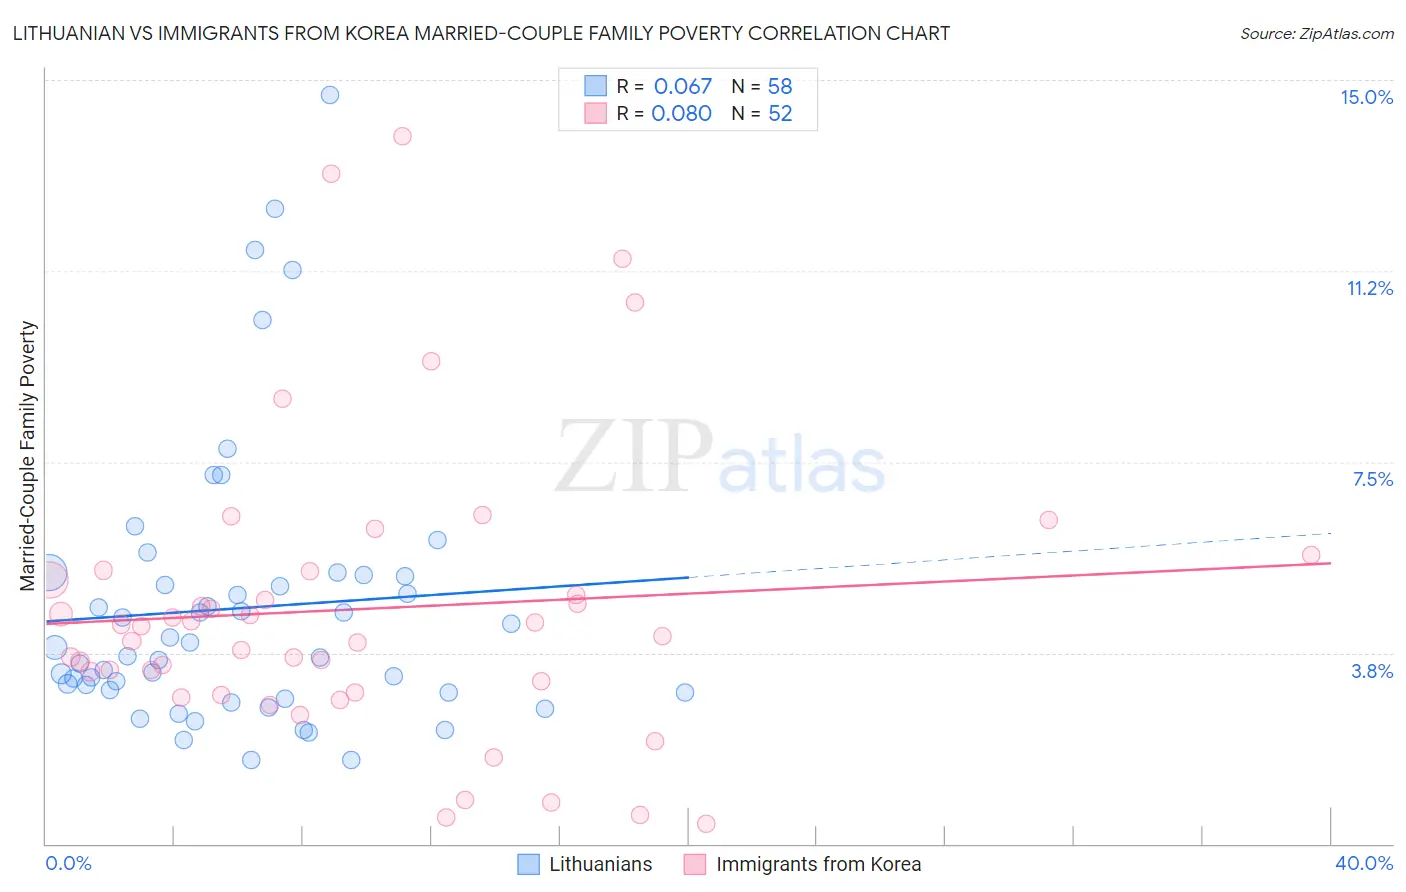
Lithuanian vs Immigrants from Korea Married-Couple Family Poverty Correlation Chart
The statistical analysis conducted on geographies consisting of 416,141,863 people shows a slight positive correlation between the proportion of Lithuanians and poverty level among married-couple families in the United States with a correlation coefficient (R) of 0.067 and weighted average of 4.0%. Similarly, the statistical analysis conducted on geographies consisting of 411,729,452 people shows a slight positive correlation between the proportion of Immigrants from Korea and poverty level among married-couple families in the United States with a correlation coefficient (R) of 0.080 and weighted average of 4.5%, a difference of 12.5%.
Married-Couple Family Poverty Correlation Summary
| Measurement | Lithuanian | Immigrants from Korea |
| Minimum | 1.6% | 0.39% |
| Maximum | 14.7% | 13.9% |
| Range | 13.1% | 13.5% |
| Mean | 4.6% | 4.6% |
| Median | 3.8% | 4.2% |
| Interquartile 25% (IQ1) | 3.0% | 3.1% |
| Interquartile 75% (IQ3) | 5.3% | 5.3% |
| Interquartile Range (IQR) | 2.3% | 2.2% |
| Standard Deviation (Sample) | 2.7% | 2.9% |
| Standard Deviation (Population) | 2.7% | 2.9% |
Similar Demographics by Married-Couple Family Poverty
Demographics Similar to Lithuanians by Married-Couple Family Poverty
In terms of married-couple family poverty, the demographic groups most similar to Lithuanians are Carpatho Rusyn (3.9%, a difference of 0.51%), Croatian (3.9%, a difference of 0.56%), Bulgarian (4.0%, a difference of 0.70%), Thai (3.9%, a difference of 1.0%), and Latvian (3.9%, a difference of 1.5%).
| Demographics | Rating | Rank | Married-Couple Family Poverty |
| Slovenes | 100.0 /100 | #4 | Exceptional 3.8% |
| Swedes | 100.0 /100 | #5 | Exceptional 3.9% |
| Luxembourgers | 100.0 /100 | #6 | Exceptional 3.9% |
| Latvians | 100.0 /100 | #7 | Exceptional 3.9% |
| Thais | 100.0 /100 | #8 | Exceptional 3.9% |
| Croatians | 100.0 /100 | #9 | Exceptional 3.9% |
| Carpatho Rusyns | 100.0 /100 | #10 | Exceptional 3.9% |
| Lithuanians | 100.0 /100 | #11 | Exceptional 4.0% |
| Bulgarians | 100.0 /100 | #12 | Exceptional 4.0% |
| Czechs | 100.0 /100 | #13 | Exceptional 4.0% |
| Slovaks | 100.0 /100 | #14 | Exceptional 4.0% |
| Poles | 100.0 /100 | #15 | Exceptional 4.0% |
| Germans | 100.0 /100 | #16 | Exceptional 4.0% |
| Filipinos | 100.0 /100 | #17 | Exceptional 4.0% |
| Italians | 100.0 /100 | #18 | Exceptional 4.0% |
Demographics Similar to Immigrants from Korea by Married-Couple Family Poverty
In terms of married-couple family poverty, the demographic groups most similar to Immigrants from Korea are New Zealander (4.4%, a difference of 0.13%), Slavic (4.4%, a difference of 0.14%), Immigrants from Canada (4.4%, a difference of 0.16%), Immigrants from Serbia (4.4%, a difference of 0.20%), and Macedonian (4.4%, a difference of 0.34%).
| Demographics | Rating | Rank | Married-Couple Family Poverty |
| Immigrants | Sri Lanka | 99.6 /100 | #63 | Exceptional 4.4% |
| Immigrants | Bulgaria | 99.5 /100 | #64 | Exceptional 4.4% |
| Macedonians | 99.4 /100 | #65 | Exceptional 4.4% |
| Immigrants | Serbia | 99.4 /100 | #66 | Exceptional 4.4% |
| Immigrants | Canada | 99.4 /100 | #67 | Exceptional 4.4% |
| Slavs | 99.4 /100 | #68 | Exceptional 4.4% |
| New Zealanders | 99.4 /100 | #69 | Exceptional 4.4% |
| Immigrants | Korea | 99.4 /100 | #70 | Exceptional 4.5% |
| Immigrants | North America | 99.3 /100 | #71 | Exceptional 4.5% |
| Immigrants | England | 99.3 /100 | #72 | Exceptional 4.5% |
| Ukrainians | 99.2 /100 | #73 | Exceptional 4.5% |
| Immigrants | Austria | 99.2 /100 | #74 | Exceptional 4.5% |
| Cambodians | 99.2 /100 | #75 | Exceptional 4.5% |
| Immigrants | South Africa | 99.1 /100 | #76 | Exceptional 4.5% |
| Immigrants | Latvia | 99.1 /100 | #77 | Exceptional 4.5% |