Lithuanian vs Yuman Married-Couple Family Poverty
COMPARE
Lithuanian
Yuman
Married-Couple Family Poverty
Married-Couple Family Poverty Comparison
Lithuanians
Yuman
4.0%
MARRIED-COUPLE FAMILY POVERTY
100.0/ 100
METRIC RATING
11th/ 347
METRIC RANK
9.7%
MARRIED-COUPLE FAMILY POVERTY
0.0/ 100
METRIC RATING
340th/ 347
METRIC RANK
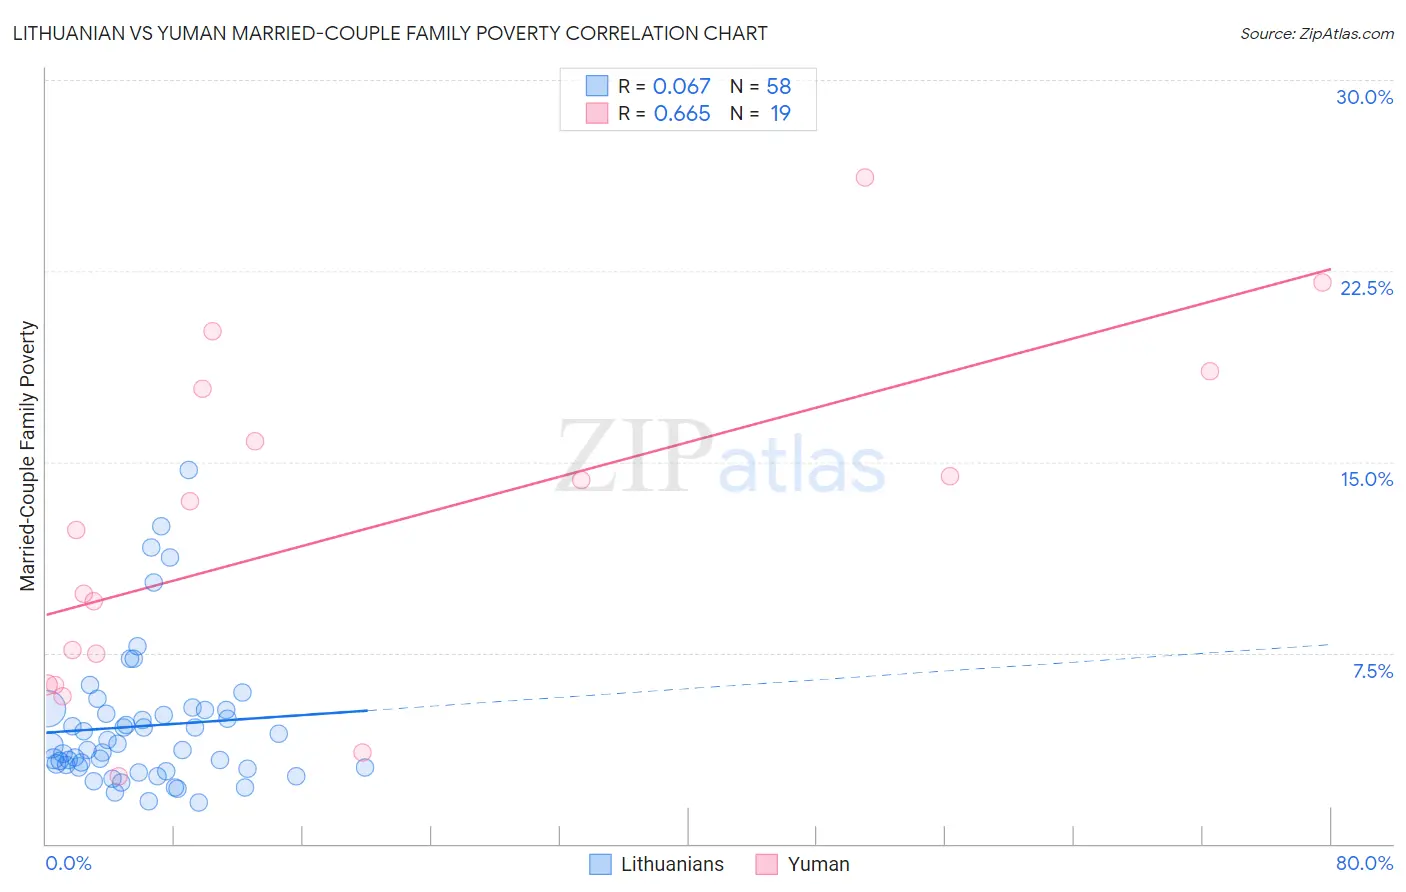
Lithuanian vs Yuman Married-Couple Family Poverty Correlation Chart
The statistical analysis conducted on geographies consisting of 416,141,863 people shows a slight positive correlation between the proportion of Lithuanians and poverty level among married-couple families in the United States with a correlation coefficient (R) of 0.067 and weighted average of 4.0%. Similarly, the statistical analysis conducted on geographies consisting of 40,644,577 people shows a significant positive correlation between the proportion of Yuman and poverty level among married-couple families in the United States with a correlation coefficient (R) of 0.665 and weighted average of 9.7%, a difference of 145.9%.
Married-Couple Family Poverty Correlation Summary
| Measurement | Lithuanian | Yuman |
| Minimum | 1.6% | 2.7% |
| Maximum | 14.7% | 26.2% |
| Range | 13.1% | 23.5% |
| Mean | 4.6% | 12.3% |
| Median | 3.8% | 12.3% |
| Interquartile 25% (IQ1) | 3.0% | 6.2% |
| Interquartile 75% (IQ3) | 5.3% | 17.9% |
| Interquartile Range (IQR) | 2.3% | 11.6% |
| Standard Deviation (Sample) | 2.7% | 6.6% |
| Standard Deviation (Population) | 2.7% | 6.4% |
Similar Demographics by Married-Couple Family Poverty
Demographics Similar to Lithuanians by Married-Couple Family Poverty
In terms of married-couple family poverty, the demographic groups most similar to Lithuanians are Carpatho Rusyn (3.9%, a difference of 0.51%), Croatian (3.9%, a difference of 0.56%), Bulgarian (4.0%, a difference of 0.70%), Thai (3.9%, a difference of 1.0%), and Latvian (3.9%, a difference of 1.5%).
| Demographics | Rating | Rank | Married-Couple Family Poverty |
| Slovenes | 100.0 /100 | #4 | Exceptional 3.8% |
| Swedes | 100.0 /100 | #5 | Exceptional 3.9% |
| Luxembourgers | 100.0 /100 | #6 | Exceptional 3.9% |
| Latvians | 100.0 /100 | #7 | Exceptional 3.9% |
| Thais | 100.0 /100 | #8 | Exceptional 3.9% |
| Croatians | 100.0 /100 | #9 | Exceptional 3.9% |
| Carpatho Rusyns | 100.0 /100 | #10 | Exceptional 3.9% |
| Lithuanians | 100.0 /100 | #11 | Exceptional 4.0% |
| Bulgarians | 100.0 /100 | #12 | Exceptional 4.0% |
| Czechs | 100.0 /100 | #13 | Exceptional 4.0% |
| Slovaks | 100.0 /100 | #14 | Exceptional 4.0% |
| Poles | 100.0 /100 | #15 | Exceptional 4.0% |
| Germans | 100.0 /100 | #16 | Exceptional 4.0% |
| Filipinos | 100.0 /100 | #17 | Exceptional 4.0% |
| Italians | 100.0 /100 | #18 | Exceptional 4.0% |
Demographics Similar to Yuman by Married-Couple Family Poverty
In terms of married-couple family poverty, the demographic groups most similar to Yuman are Crow (9.6%, a difference of 1.8%), Cheyenne (9.4%, a difference of 3.2%), Yakama (9.0%, a difference of 8.7%), Apache (9.0%, a difference of 8.7%), and Sioux (8.7%, a difference of 11.9%).
| Demographics | Rating | Rank | Married-Couple Family Poverty |
| Lumbee | 0.0 /100 | #333 | Tragic 8.3% |
| Immigrants | Dominican Republic | 0.0 /100 | #334 | Tragic 8.4% |
| Sioux | 0.0 /100 | #335 | Tragic 8.7% |
| Apache | 0.0 /100 | #336 | Tragic 9.0% |
| Yakama | 0.0 /100 | #337 | Tragic 9.0% |
| Cheyenne | 0.0 /100 | #338 | Tragic 9.4% |
| Crow | 0.0 /100 | #339 | Tragic 9.6% |
| Yuman | 0.0 /100 | #340 | Tragic 9.7% |
| Pueblo | 0.0 /100 | #341 | Tragic 11.1% |
| Tohono O'odham | 0.0 /100 | #342 | Tragic 11.2% |
| Pima | 0.0 /100 | #343 | Tragic 11.4% |
| Navajo | 0.0 /100 | #344 | Tragic 11.9% |
| Puerto Ricans | 0.0 /100 | #345 | Tragic 12.6% |
| Immigrants | Yemen | 0.0 /100 | #346 | Tragic 12.8% |
| Yup'ik | 0.0 /100 | #347 | Tragic 13.4% |