Lithuanian 2 or more Vehicles in Household
COMPARE
Lithuanian
Select to Compare
2 or more Vehicles in Household
Lithuanian 2 or more Vehicles in Household
58.2%
2+ VEHICLES AVAILABLE
99.5/ 100
METRIC RATING
78th/ 347
METRIC RANK
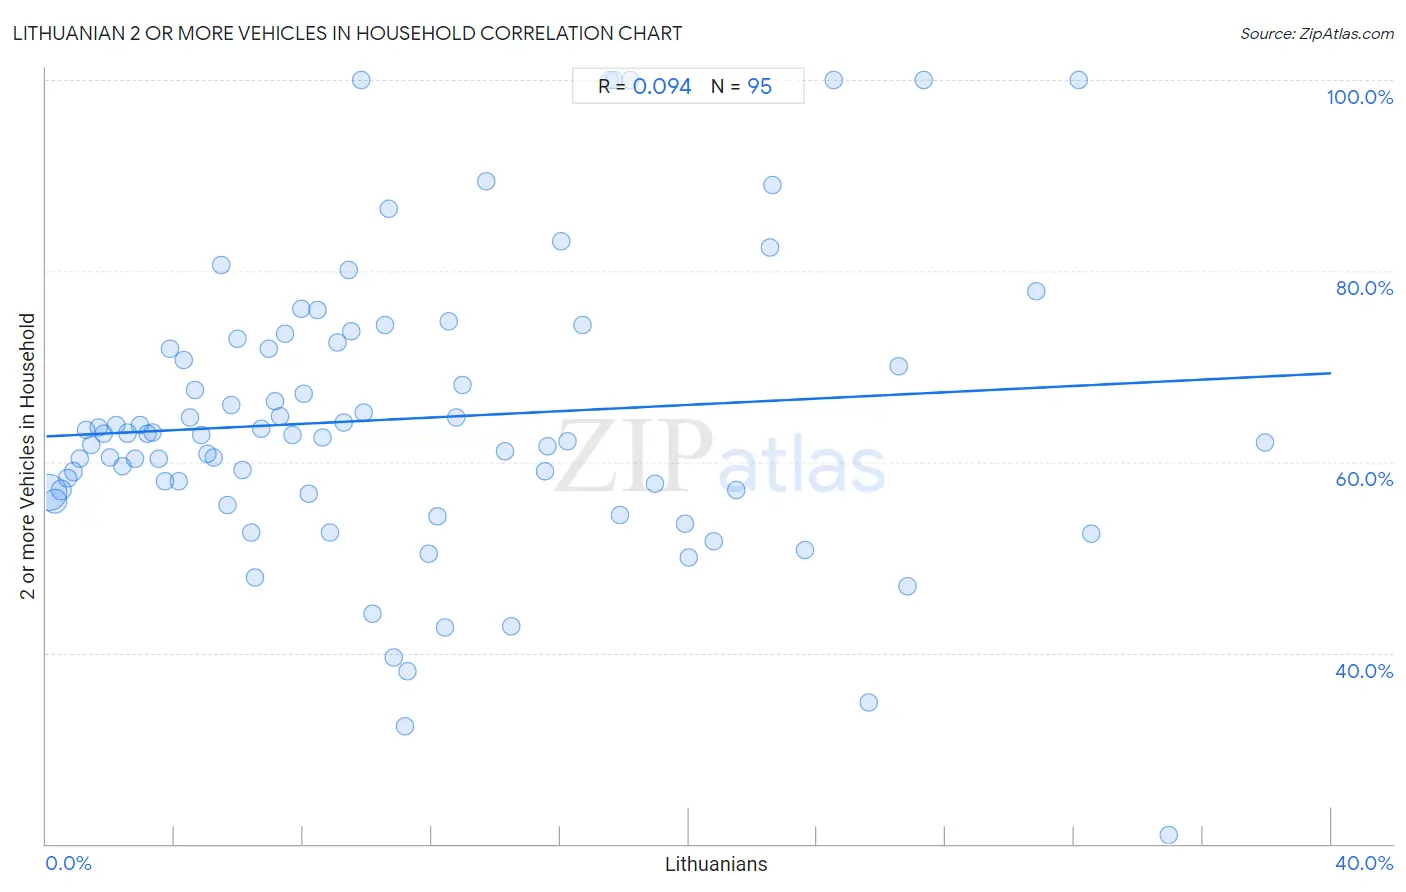
Lithuanian 2 or more Vehicles in Household Correlation Chart
The statistical analysis conducted on geographies consisting of 421,771,699 people shows a slight positive correlation between the proportion of Lithuanians and percentage of households with 2 or more vehicles available in the United States with a correlation coefficient (R) of 0.094 and weighted average of 58.2%. On average, for every 1% (one percent) increase in Lithuanians within a typical geography, there is an increase of 0.17% in percentage of households with 2 or more vehicles available.
It is essential to understand that the correlation between the percentage of Lithuanians and percentage of households with 2 or more vehicles available does not imply a direct cause-and-effect relationship. It remains uncertain whether the presence of Lithuanians influences an upward or downward trend in the level of percentage of households with 2 or more vehicles available within an area, or if Lithuanians simply ended up residing in those areas with higher or lower levels of percentage of households with 2 or more vehicles available due to other factors.
Demographics Similar to Lithuanians by 2 or more Vehicles in Household
In terms of 2 or more vehicles in household, the demographic groups most similar to Lithuanians are Slovene (58.3%, a difference of 0.050%), Creek (58.3%, a difference of 0.060%), Delaware (58.2%, a difference of 0.080%), Polish (58.3%, a difference of 0.10%), and Immigrants from Afghanistan (58.3%, a difference of 0.17%).
| Demographics | Rating | Rank | 2 or more Vehicles in Household |
| Bangladeshis | 99.6 /100 | #71 | Exceptional 58.4% |
| Austrians | 99.6 /100 | #72 | Exceptional 58.4% |
| Bolivians | 99.6 /100 | #73 | Exceptional 58.3% |
| Immigrants from Afghanistan | 99.6 /100 | #74 | Exceptional 58.3% |
| Poles | 99.5 /100 | #75 | Exceptional 58.3% |
| Creek | 99.5 /100 | #76 | Exceptional 58.3% |
| Slovenes | 99.5 /100 | #77 | Exceptional 58.3% |
| Lithuanians | 99.5 /100 | #78 | Exceptional 58.2% |
| Delaware | 99.4 /100 | #79 | Exceptional 58.2% |
| Immigrants from England | 99.3 /100 | #80 | Exceptional 58.1% |
| Immigrants from Iraq | 99.3 /100 | #81 | Exceptional 58.1% |
| Iranians | 99.3 /100 | #82 | Exceptional 58.1% |
| Icelanders | 99.2 /100 | #83 | Exceptional 58.0% |
| Maltese | 99.2 /100 | #84 | Exceptional 58.0% |
| Slovaks | 99.2 /100 | #85 | Exceptional 58.0% |
Lithuanian 2 or more Vehicles in Household Correlation Summary
| Measurement | Lithuanian Data | 2 or more Vehicles in Household Data |
| Minimum | 0.087% | 20.9% |
| Maximum | 37.9% | 100.0% |
| Range | 37.8% | 79.1% |
| Mean | 11.2% | 64.5% |
| Median | 9.1% | 62.8% |
| Interquartile 25% (IQ1) | 4.5% | 56.8% |
| Interquartile 75% (IQ3) | 16.2% | 72.5% |
| Interquartile Range (IQR) | 11.8% | 15.7% |
| Standard Deviation (Sample) | 8.8% | 15.4% |
| Standard Deviation (Population) | 8.8% | 15.4% |
Correlation Details
| Lithuanian Percentile | Sample Size | 2 or more Vehicles in Household |
[ 0.0% - 0.5% ] 0.087% | 258,934,877 | 56.8% |
[ 0.0% - 0.5% ] 0.27% | 88,699,449 | 55.9% |
[ 0.0% - 0.5% ] 0.46% | 35,434,344 | 57.0% |
[ 0.5% - 1.0% ] 0.65% | 14,699,830 | 58.3% |
[ 0.5% - 1.0% ] 0.84% | 8,291,699 | 59.0% |
[ 1.0% - 1.5% ] 1.03% | 5,345,748 | 60.4% |
[ 1.0% - 1.5% ] 1.23% | 2,656,946 | 63.3% |
[ 1.0% - 1.5% ] 1.41% | 1,822,170 | 61.8% |
[ 1.5% - 2.0% ] 1.62% | 1,207,735 | 63.7% |
[ 1.5% - 2.0% ] 1.79% | 1,041,592 | 63.0% |
[ 1.5% - 2.0% ] 1.99% | 742,160 | 60.4% |
[ 2.0% - 2.5% ] 2.19% | 683,604 | 63.8% |
[ 2.0% - 2.5% ] 2.37% | 533,397 | 59.6% |
[ 2.5% - 3.0% ] 2.53% | 315,300 | 63.0% |
[ 2.5% - 3.0% ] 2.76% | 281,005 | 60.3% |
[ 2.5% - 3.0% ] 2.93% | 90,345 | 63.8% |
[ 3.0% - 3.5% ] 3.16% | 83,779 | 63.0% |
[ 3.0% - 3.5% ] 3.32% | 97,616 | 63.1% |
[ 3.5% - 4.0% ] 3.52% | 136,192 | 60.3% |
[ 3.5% - 4.0% ] 3.70% | 57,190 | 57.9% |
[ 3.5% - 4.0% ] 3.87% | 25,329 | 71.8% |
[ 4.0% - 4.5% ] 4.12% | 79,734 | 58.0% |
[ 4.0% - 4.5% ] 4.27% | 82,752 | 70.6% |
[ 4.0% - 4.5% ] 4.46% | 40,826 | 64.6% |
[ 4.5% - 5.0% ] 4.63% | 50,106 | 67.5% |
[ 4.5% - 5.0% ] 4.81% | 16,701 | 62.8% |
[ 5.0% - 5.5% ] 5.01% | 73,509 | 60.9% |
[ 5.0% - 5.5% ] 5.23% | 18,791 | 60.5% |
[ 5.0% - 5.5% ] 5.44% | 8,056 | 80.6% |
[ 5.5% - 6.0% ] 5.64% | 7,585 | 55.5% |
[ 5.5% - 6.0% ] 5.76% | 9,289 | 65.9% |
[ 5.5% - 6.0% ] 5.95% | 23,690 | 72.8% |
[ 6.0% - 6.5% ] 6.09% | 5,877 | 59.2% |
[ 6.0% - 6.5% ] 6.38% | 10,735 | 52.5% |
[ 6.5% - 7.0% ] 6.51% | 10,238 | 47.9% |
[ 6.5% - 7.0% ] 6.71% | 3,397 | 63.5% |
[ 6.5% - 7.0% ] 6.94% | 2,191 | 71.9% |
[ 7.0% - 7.5% ] 7.12% | 6,842 | 66.4% |
[ 7.0% - 7.5% ] 7.28% | 6,466 | 64.8% |
[ 7.0% - 7.5% ] 7.45% | 2,712 | 73.5% |
[ 7.5% - 8.0% ] 7.65% | 3,907 | 62.8% |
[ 7.5% - 8.0% ] 7.94% | 2,014 | 76.1% |
[ 8.0% - 8.5% ] 8.03% | 7,300 | 67.2% |
[ 8.0% - 8.5% ] 8.18% | 1,394 | 56.7% |
[ 8.0% - 8.5% ] 8.46% | 7,353 | 75.9% |
[ 8.5% - 9.0% ] 8.62% | 441 | 62.6% |
[ 8.5% - 9.0% ] 8.82% | 13,542 | 52.6% |
[ 9.0% - 9.5% ] 9.08% | 3,834 | 72.5% |
[ 9.0% - 9.5% ] 9.24% | 12,486 | 64.2% |
[ 9.0% - 9.5% ] 9.44% | 1,028 | 80.1% |
[ 9.5% - 10.0% ] 9.50% | 29,288 | 73.7% |
[ 9.5% - 10.0% ] 9.79% | 388 | 100.0% |
[ 9.5% - 10.0% ] 9.90% | 22,551 | 65.2% |
[ 10.0% - 10.5% ] 10.14% | 345 | 44.0% |
[ 10.5% - 11.0% ] 10.56% | 161 | 74.3% |
[ 10.5% - 11.0% ] 10.68% | 103 | 86.5% |
[ 10.5% - 11.0% ] 10.82% | 3,411 | 39.5% |
[ 11.0% - 11.5% ] 11.19% | 447 | 32.2% |
[ 11.0% - 11.5% ] 11.26% | 3,243 | 38.1% |
[ 11.5% - 12.0% ] 11.90% | 420 | 50.3% |
[ 12.0% - 12.5% ] 12.19% | 886 | 54.4% |
[ 12.0% - 12.5% ] 12.40% | 1,572 | 42.7% |
[ 12.5% - 13.0% ] 12.54% | 295 | 74.7% |
[ 12.5% - 13.0% ] 12.78% | 1,409 | 64.7% |
[ 12.5% - 13.0% ] 12.94% | 85 | 68.0% |
[ 13.5% - 14.0% ] 13.71% | 875 | 89.4% |
[ 14.0% - 14.5% ] 14.29% | 231 | 61.1% |
[ 14.0% - 14.5% ] 14.46% | 1,514 | 42.8% |
[ 15.5% - 16.0% ] 15.53% | 1,668 | 59.0% |
[ 15.5% - 16.0% ] 15.60% | 327 | 61.6% |
[ 16.0% - 16.5% ] 16.04% | 804 | 83.1% |
[ 16.0% - 16.5% ] 16.24% | 234 | 62.2% |
[ 16.5% - 17.0% ] 16.70% | 1,383 | 74.4% |
[ 17.5% - 18.0% ] 17.54% | 57 | 100.0% |
[ 17.5% - 18.0% ] 17.67% | 249 | 100.0% |
[ 17.5% - 18.0% ] 17.86% | 308 | 54.4% |
[ 18.0% - 18.5% ] 18.18% | 44 | 100.0% |
[ 18.5% - 19.0% ] 18.97% | 116 | 57.7% |
[ 19.5% - 20.0% ] 19.87% | 1,052 | 53.6% |
[ 20.0% - 20.5% ] 20.00% | 40 | 50.0% |
[ 20.5% - 21.0% ] 20.79% | 433 | 51.6% |
[ 21.0% - 21.5% ] 21.47% | 652 | 57.1% |
[ 22.5% - 23.0% ] 22.52% | 595 | 82.5% |
[ 22.5% - 23.0% ] 22.61% | 690 | 89.0% |
[ 23.5% - 24.0% ] 23.64% | 110 | 50.7% |
[ 24.5% - 25.0% ] 24.52% | 310 | 100.0% |
[ 25.5% - 26.0% ] 25.60% | 250 | 34.8% |
[ 26.5% - 27.0% ] 26.55% | 531 | 70.0% |
[ 26.5% - 27.0% ] 26.81% | 235 | 47.0% |
[ 27.0% - 27.5% ] 27.32% | 205 | 100.0% |
[ 30.5% - 31.0% ] 30.84% | 467 | 77.9% |
[ 32.0% - 32.5% ] 32.14% | 168 | 100.0% |
[ 32.5% - 33.0% ] 32.54% | 209 | 52.5% |
[ 34.5% - 35.0% ] 34.95% | 206 | 20.9% |
[ 37.5% - 38.0% ] 37.93% | 29 | 62.1% |