Lithuanian vs Immigrants from Chile Married-Couple Family Poverty
COMPARE
Lithuanian
Immigrants from Chile
Married-Couple Family Poverty
Married-Couple Family Poverty Comparison
Lithuanians
Immigrants from Chile
4.0%
MARRIED-COUPLE FAMILY POVERTY
100.0/ 100
METRIC RATING
11th/ 347
METRIC RANK
5.3%
MARRIED-COUPLE FAMILY POVERTY
38.8/ 100
METRIC RATING
181st/ 347
METRIC RANK
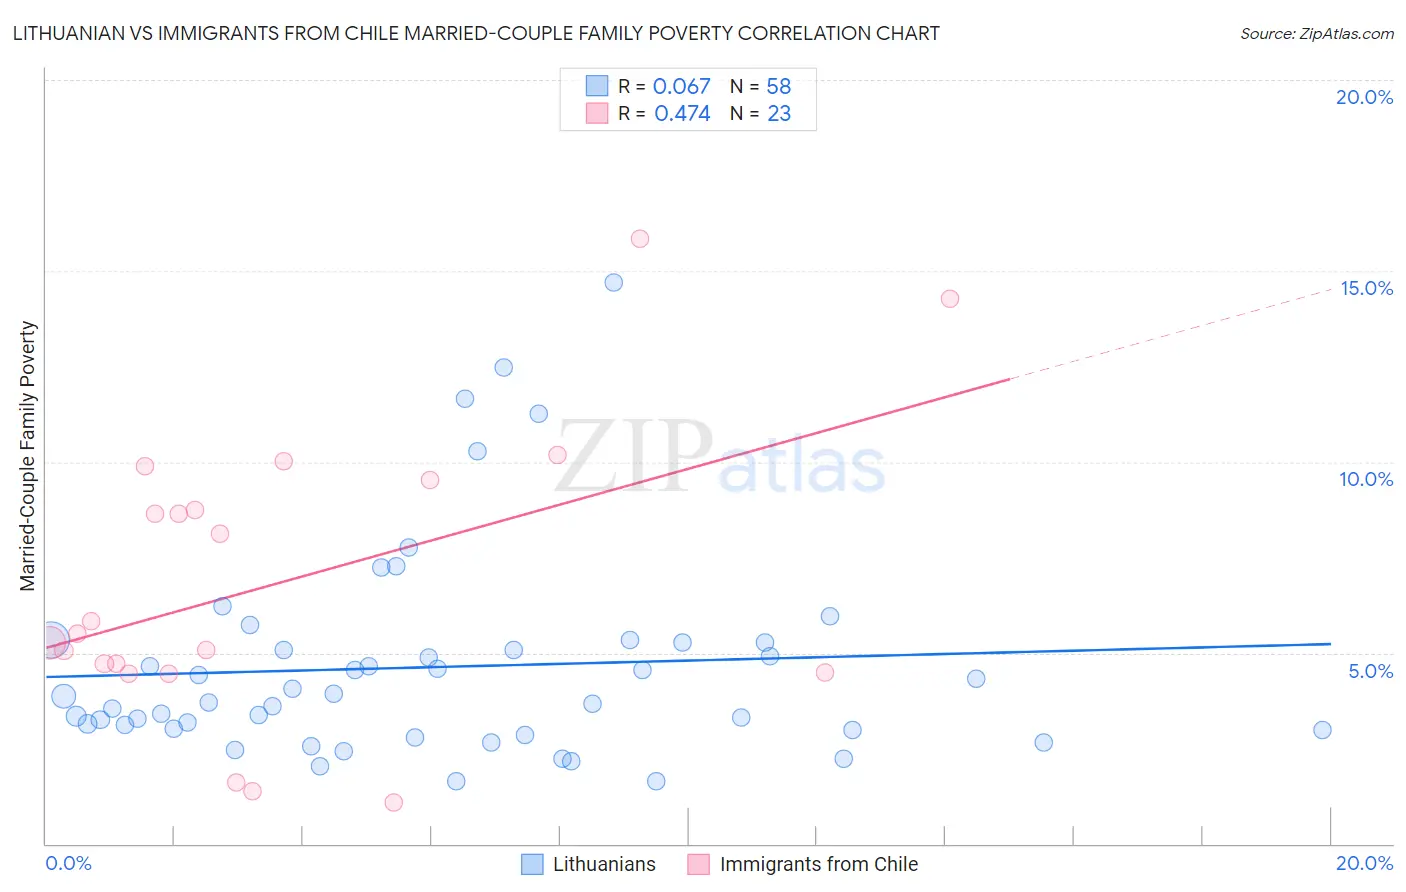
Lithuanian vs Immigrants from Chile Married-Couple Family Poverty Correlation Chart
The statistical analysis conducted on geographies consisting of 416,141,863 people shows a slight positive correlation between the proportion of Lithuanians and poverty level among married-couple families in the United States with a correlation coefficient (R) of 0.067 and weighted average of 4.0%. Similarly, the statistical analysis conducted on geographies consisting of 217,797,721 people shows a moderate positive correlation between the proportion of Immigrants from Chile and poverty level among married-couple families in the United States with a correlation coefficient (R) of 0.474 and weighted average of 5.3%, a difference of 33.6%.
Married-Couple Family Poverty Correlation Summary
| Measurement | Lithuanian | Immigrants from Chile |
| Minimum | 1.6% | 1.1% |
| Maximum | 14.7% | 15.9% |
| Range | 13.1% | 14.8% |
| Mean | 4.6% | 6.8% |
| Median | 3.8% | 5.5% |
| Interquartile 25% (IQ1) | 3.0% | 4.5% |
| Interquartile 75% (IQ3) | 5.3% | 9.5% |
| Interquartile Range (IQR) | 2.3% | 5.0% |
| Standard Deviation (Sample) | 2.7% | 3.8% |
| Standard Deviation (Population) | 2.7% | 3.7% |
Similar Demographics by Married-Couple Family Poverty
Demographics Similar to Lithuanians by Married-Couple Family Poverty
In terms of married-couple family poverty, the demographic groups most similar to Lithuanians are Carpatho Rusyn (3.9%, a difference of 0.51%), Croatian (3.9%, a difference of 0.56%), Bulgarian (4.0%, a difference of 0.70%), Thai (3.9%, a difference of 1.0%), and Latvian (3.9%, a difference of 1.5%).
| Demographics | Rating | Rank | Married-Couple Family Poverty |
| Slovenes | 100.0 /100 | #4 | Exceptional 3.8% |
| Swedes | 100.0 /100 | #5 | Exceptional 3.9% |
| Luxembourgers | 100.0 /100 | #6 | Exceptional 3.9% |
| Latvians | 100.0 /100 | #7 | Exceptional 3.9% |
| Thais | 100.0 /100 | #8 | Exceptional 3.9% |
| Croatians | 100.0 /100 | #9 | Exceptional 3.9% |
| Carpatho Rusyns | 100.0 /100 | #10 | Exceptional 3.9% |
| Lithuanians | 100.0 /100 | #11 | Exceptional 4.0% |
| Bulgarians | 100.0 /100 | #12 | Exceptional 4.0% |
| Czechs | 100.0 /100 | #13 | Exceptional 4.0% |
| Slovaks | 100.0 /100 | #14 | Exceptional 4.0% |
| Poles | 100.0 /100 | #15 | Exceptional 4.0% |
| Germans | 100.0 /100 | #16 | Exceptional 4.0% |
| Filipinos | 100.0 /100 | #17 | Exceptional 4.0% |
| Italians | 100.0 /100 | #18 | Exceptional 4.0% |
Demographics Similar to Immigrants from Chile by Married-Couple Family Poverty
In terms of married-couple family poverty, the demographic groups most similar to Immigrants from Chile are Immigrants from Sierra Leone (5.3%, a difference of 0.060%), Immigrants from Vietnam (5.3%, a difference of 0.13%), Peruvian (5.3%, a difference of 0.14%), Spanish (5.3%, a difference of 0.31%), and Nonimmigrants (5.3%, a difference of 0.37%).
| Demographics | Rating | Rank | Married-Couple Family Poverty |
| Immigrants | Eastern Africa | 50.0 /100 | #174 | Average 5.2% |
| Marshallese | 47.9 /100 | #175 | Average 5.2% |
| Menominee | 47.8 /100 | #176 | Average 5.2% |
| Immigrants | Kazakhstan | 45.1 /100 | #177 | Average 5.2% |
| Immigrants | Ukraine | 44.9 /100 | #178 | Average 5.2% |
| Spanish | 41.4 /100 | #179 | Average 5.3% |
| Immigrants | Sierra Leone | 39.3 /100 | #180 | Fair 5.3% |
| Immigrants | Chile | 38.8 /100 | #181 | Fair 5.3% |
| Immigrants | Vietnam | 37.7 /100 | #182 | Fair 5.3% |
| Peruvians | 37.6 /100 | #183 | Fair 5.3% |
| Immigrants | Nonimmigrants | 35.8 /100 | #184 | Fair 5.3% |
| Americans | 35.4 /100 | #185 | Fair 5.3% |
| Hungarians | 34.7 /100 | #186 | Fair 5.3% |
| Immigrants | Albania | 33.8 /100 | #187 | Fair 5.3% |
| Israelis | 33.1 /100 | #188 | Fair 5.3% |