Lithuanian vs Cree Married-Couple Family Poverty
COMPARE
Lithuanian
Cree
Married-Couple Family Poverty
Married-Couple Family Poverty Comparison
Lithuanians
Cree
4.0%
MARRIED-COUPLE FAMILY POVERTY
100.0/ 100
METRIC RATING
11th/ 347
METRIC RANK
5.9%
MARRIED-COUPLE FAMILY POVERTY
1.2/ 100
METRIC RATING
248th/ 347
METRIC RANK
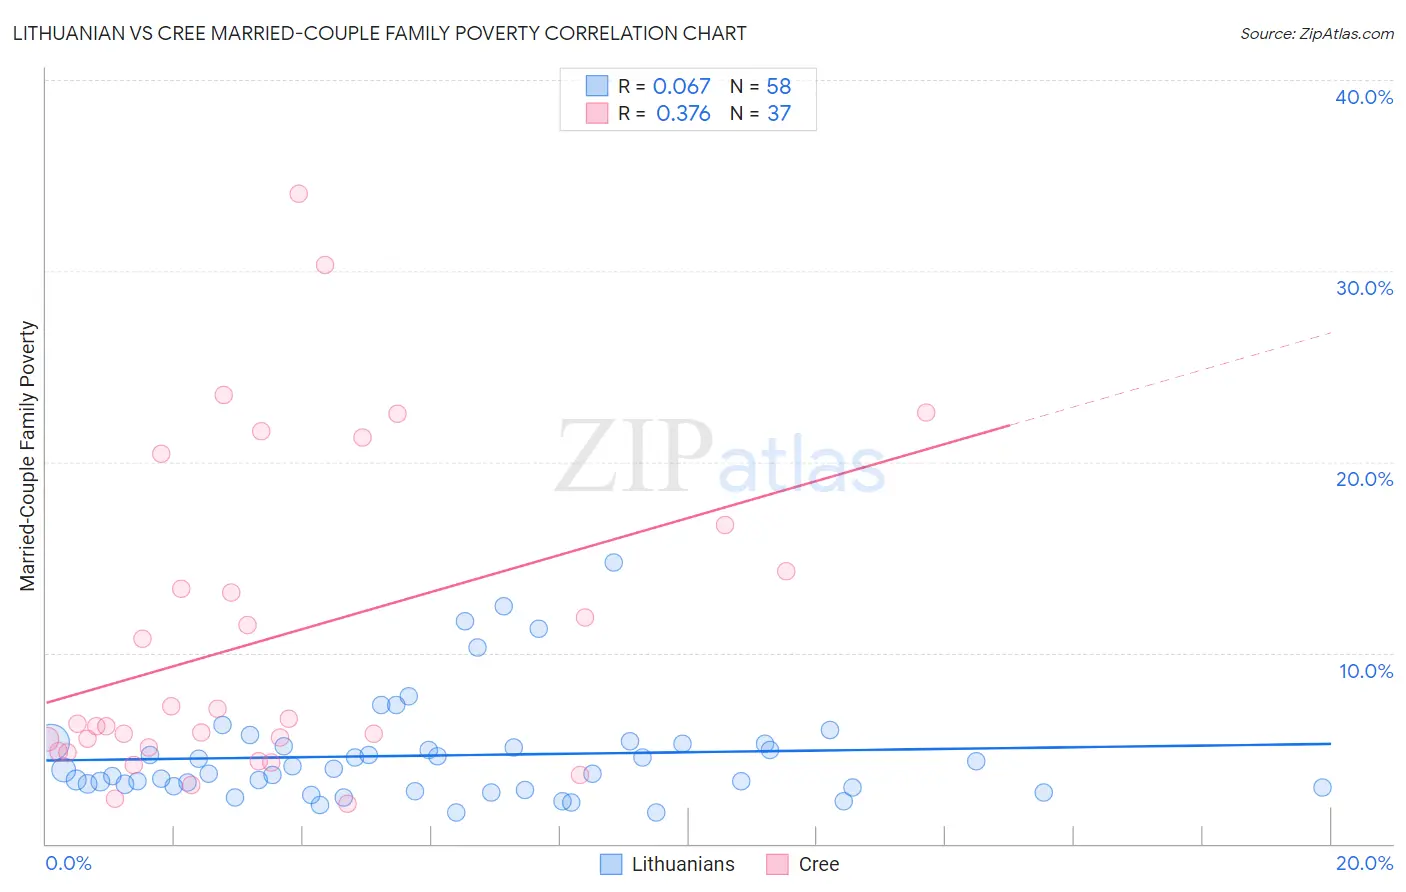
Lithuanian vs Cree Married-Couple Family Poverty Correlation Chart
The statistical analysis conducted on geographies consisting of 416,141,863 people shows a slight positive correlation between the proportion of Lithuanians and poverty level among married-couple families in the United States with a correlation coefficient (R) of 0.067 and weighted average of 4.0%. Similarly, the statistical analysis conducted on geographies consisting of 76,066,052 people shows a mild positive correlation between the proportion of Cree and poverty level among married-couple families in the United States with a correlation coefficient (R) of 0.376 and weighted average of 5.9%, a difference of 48.7%.
Married-Couple Family Poverty Correlation Summary
| Measurement | Lithuanian | Cree |
| Minimum | 1.6% | 2.1% |
| Maximum | 14.7% | 34.0% |
| Range | 13.1% | 31.9% |
| Mean | 4.6% | 10.8% |
| Median | 3.8% | 6.3% |
| Interquartile 25% (IQ1) | 3.0% | 4.9% |
| Interquartile 75% (IQ3) | 5.3% | 15.5% |
| Interquartile Range (IQR) | 2.3% | 10.5% |
| Standard Deviation (Sample) | 2.7% | 8.3% |
| Standard Deviation (Population) | 2.7% | 8.2% |
Similar Demographics by Married-Couple Family Poverty
Demographics Similar to Lithuanians by Married-Couple Family Poverty
In terms of married-couple family poverty, the demographic groups most similar to Lithuanians are Carpatho Rusyn (3.9%, a difference of 0.51%), Croatian (3.9%, a difference of 0.56%), Bulgarian (4.0%, a difference of 0.70%), Thai (3.9%, a difference of 1.0%), and Latvian (3.9%, a difference of 1.5%).
| Demographics | Rating | Rank | Married-Couple Family Poverty |
| Slovenes | 100.0 /100 | #4 | Exceptional 3.8% |
| Swedes | 100.0 /100 | #5 | Exceptional 3.9% |
| Luxembourgers | 100.0 /100 | #6 | Exceptional 3.9% |
| Latvians | 100.0 /100 | #7 | Exceptional 3.9% |
| Thais | 100.0 /100 | #8 | Exceptional 3.9% |
| Croatians | 100.0 /100 | #9 | Exceptional 3.9% |
| Carpatho Rusyns | 100.0 /100 | #10 | Exceptional 3.9% |
| Lithuanians | 100.0 /100 | #11 | Exceptional 4.0% |
| Bulgarians | 100.0 /100 | #12 | Exceptional 4.0% |
| Czechs | 100.0 /100 | #13 | Exceptional 4.0% |
| Slovaks | 100.0 /100 | #14 | Exceptional 4.0% |
| Poles | 100.0 /100 | #15 | Exceptional 4.0% |
| Germans | 100.0 /100 | #16 | Exceptional 4.0% |
| Filipinos | 100.0 /100 | #17 | Exceptional 4.0% |
| Italians | 100.0 /100 | #18 | Exceptional 4.0% |
Demographics Similar to Cree by Married-Couple Family Poverty
In terms of married-couple family poverty, the demographic groups most similar to Cree are Tsimshian (5.9%, a difference of 0.10%), Immigrants from Eritrea (5.9%, a difference of 0.31%), Iraqi (5.9%, a difference of 0.42%), Immigrants from Ghana (5.9%, a difference of 0.57%), and Immigrants from Venezuela (5.8%, a difference of 1.0%).
| Demographics | Rating | Rank | Married-Couple Family Poverty |
| Immigrants | Panama | 2.5 /100 | #241 | Tragic 5.8% |
| Immigrants | Western Africa | 2.4 /100 | #242 | Tragic 5.8% |
| Somalis | 2.3 /100 | #243 | Tragic 5.8% |
| Chickasaw | 2.3 /100 | #244 | Tragic 5.8% |
| Immigrants | Afghanistan | 2.1 /100 | #245 | Tragic 5.8% |
| Immigrants | Venezuela | 1.8 /100 | #246 | Tragic 5.8% |
| Iraqis | 1.4 /100 | #247 | Tragic 5.9% |
| Cree | 1.2 /100 | #248 | Tragic 5.9% |
| Tsimshian | 1.1 /100 | #249 | Tragic 5.9% |
| Immigrants | Eritrea | 1.1 /100 | #250 | Tragic 5.9% |
| Immigrants | Ghana | 1.0 /100 | #251 | Tragic 5.9% |
| Immigrants | Western Asia | 0.7 /100 | #252 | Tragic 6.0% |
| Africans | 0.7 /100 | #253 | Tragic 6.0% |
| Immigrants | Somalia | 0.7 /100 | #254 | Tragic 6.0% |
| Comanche | 0.7 /100 | #255 | Tragic 6.0% |