Irish 4 or more Vehicles in Household
COMPARE
Irish
Select to Compare
4 or more Vehicles in Household
Irish 4 or more Vehicles in Household
7.1%
4+ VEHICLES AVAILABLE
99.0/ 100
METRIC RATING
98th/ 347
METRIC RANK
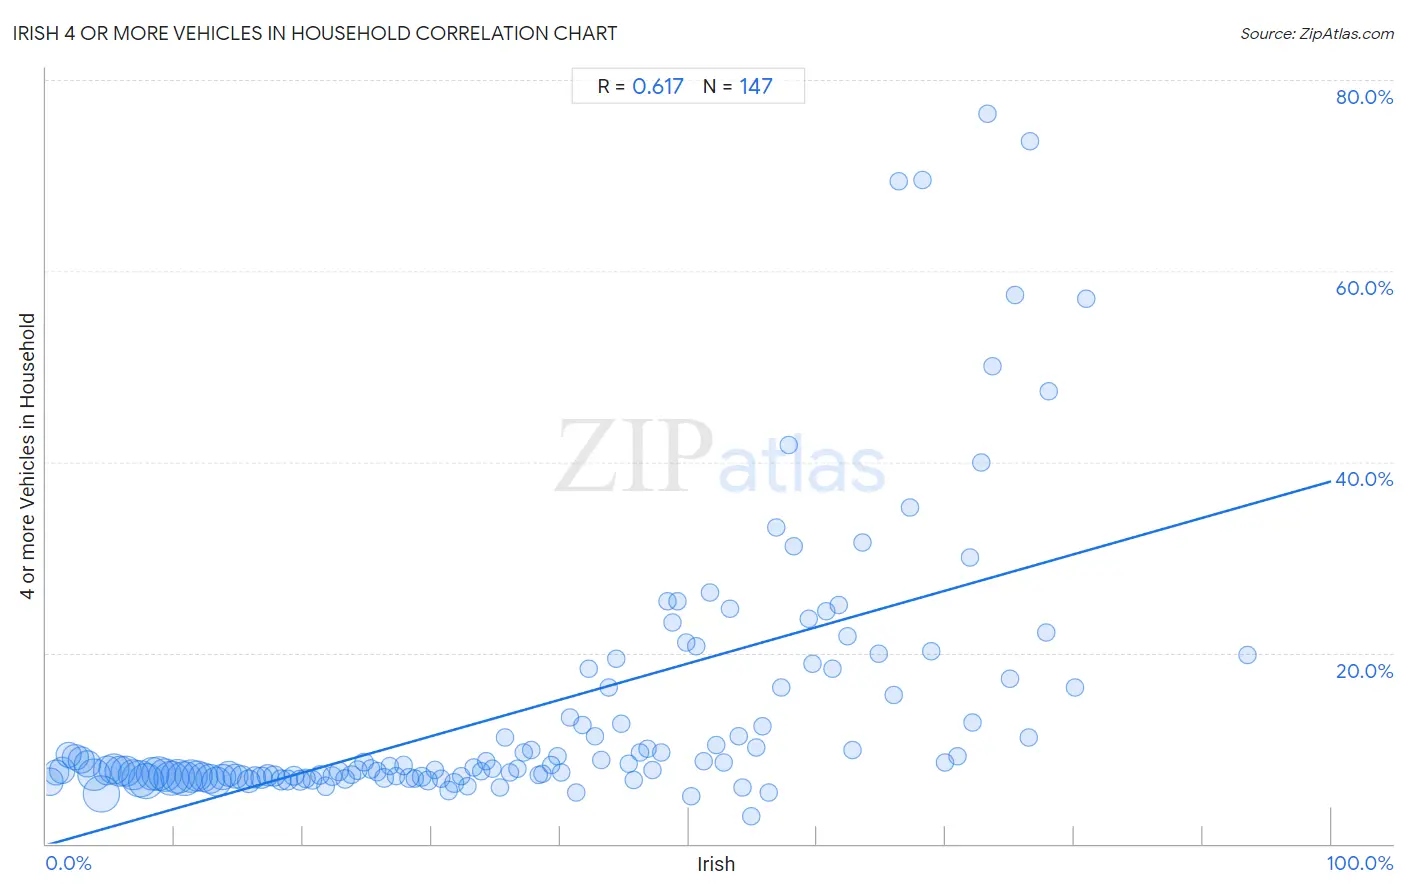
Irish 4 or more Vehicles in Household Correlation Chart
The statistical analysis conducted on geographies consisting of 576,295,994 people shows a significant positive correlation between the proportion of Irish and percentage of households with 4 or more vehicles available in the United States with a correlation coefficient (R) of 0.617 and weighted average of 7.1%. On average, for every 1% (one percent) increase in Irish within a typical geography, there is an increase of 0.38% in percentage of households with 4 or more vehicles available.
It is essential to understand that the correlation between the percentage of Irish and percentage of households with 4 or more vehicles available does not imply a direct cause-and-effect relationship. It remains uncertain whether the presence of Irish influences an upward or downward trend in the level of percentage of households with 4 or more vehicles available within an area, or if Irish simply ended up residing in those areas with higher or lower levels of percentage of households with 4 or more vehicles available due to other factors.
Demographics Similar to Irish by 4 or more Vehicles in Household
In terms of 4 or more vehicles in household, the demographic groups most similar to Irish are Celtic (7.1%, a difference of 0.42%), Seminole (7.0%, a difference of 0.44%), Taiwanese (7.0%, a difference of 0.52%), Pakistani (7.0%, a difference of 0.59%), and Asian (7.0%, a difference of 0.66%).
| Demographics | Rating | Rank | 4 or more Vehicles in Household |
| Assyrians/Chaldeans/Syriacs | 99.4 /100 | #91 | Exceptional 7.2% |
| Immigrants from Latin America | 99.4 /100 | #92 | Exceptional 7.1% |
| Immigrants from Afghanistan | 99.3 /100 | #93 | Exceptional 7.1% |
| Dutch West Indians | 99.3 /100 | #94 | Exceptional 7.1% |
| Czechoslovakians | 99.3 /100 | #95 | Exceptional 7.1% |
| Central Americans | 99.3 /100 | #96 | Exceptional 7.1% |
| Celtics | 99.1 /100 | #97 | Exceptional 7.1% |
| Irish | 99.0 /100 | #98 | Exceptional 7.1% |
| Seminole | 98.8 /100 | #99 | Exceptional 7.0% |
| Taiwanese | 98.7 /100 | #100 | Exceptional 7.0% |
| Pakistanis | 98.7 /100 | #101 | Exceptional 7.0% |
| Asians | 98.6 /100 | #102 | Exceptional 7.0% |
| Blackfeet | 98.6 /100 | #103 | Exceptional 7.0% |
| Hmong | 98.3 /100 | #104 | Exceptional 7.0% |
| German Russians | 98.3 /100 | #105 | Exceptional 7.0% |
Irish 4 or more Vehicles in Household Correlation Summary
| Measurement | Irish Data | 4 or more Vehicles in Household Data |
| Minimum | 0.26% | 2.8% |
| Maximum | 93.5% | 76.5% |
| Range | 93.2% | 73.6% |
| Mean | 37.6% | 14.2% |
| Median | 36.7% | 7.9% |
| Interquartile 25% (IQ1) | 18.2% | 7.0% |
| Interquartile 75% (IQ3) | 55.3% | 16.4% |
| Interquartile Range (IQR) | 37.0% | 9.4% |
| Standard Deviation (Sample) | 22.7% | 14.0% |
| Standard Deviation (Population) | 22.7% | 14.0% |
Correlation Details
| Irish Percentile | Sample Size | 4 or more Vehicles in Household |
[ 0.0% - 0.5% ] 0.26% | 12,469,703 | 6.5% |
[ 0.5% - 1.0% ] 0.73% | 10,276,187 | 7.4% |
[ 1.0% - 1.5% ] 1.26% | 11,105,880 | 7.7% |
[ 1.5% - 2.0% ] 1.76% | 10,643,836 | 9.3% |
[ 2.0% - 2.5% ] 2.26% | 11,074,786 | 9.1% |
[ 2.5% - 3.0% ] 2.74% | 11,968,528 | 8.8% |
[ 3.0% - 3.5% ] 3.25% | 11,795,076 | 8.4% |
[ 3.5% - 4.0% ] 3.71% | 19,649,052 | 7.2% |
[ 4.0% - 4.5% ] 4.30% | 25,322,334 | 5.2% |
[ 4.5% - 5.0% ] 4.74% | 14,262,279 | 7.7% |
[ 5.0% - 5.5% ] 5.24% | 16,754,136 | 7.9% |
[ 5.5% - 6.0% ] 5.74% | 17,349,096 | 7.6% |
[ 6.0% - 6.5% ] 6.25% | 17,435,946 | 7.6% |
[ 6.5% - 7.0% ] 6.76% | 17,945,592 | 7.2% |
[ 7.0% - 7.5% ] 7.25% | 25,745,596 | 6.9% |
[ 7.5% - 8.0% ] 7.75% | 24,459,842 | 6.6% |
[ 8.0% - 8.5% ] 8.26% | 20,495,650 | 7.3% |
[ 8.5% - 9.0% ] 8.73% | 22,563,782 | 7.3% |
[ 9.0% - 9.5% ] 9.25% | 20,452,693 | 7.3% |
[ 9.5% - 10.0% ] 9.75% | 23,615,498 | 6.9% |
[ 10.0% - 10.5% ] 10.24% | 21,817,349 | 7.1% |
[ 10.5% - 11.0% ] 10.74% | 22,642,280 | 6.9% |
[ 11.0% - 11.5% ] 11.26% | 21,076,487 | 7.0% |
[ 11.5% - 12.0% ] 11.76% | 17,935,460 | 7.1% |
[ 12.0% - 12.5% ] 12.23% | 16,312,127 | 7.0% |
[ 12.5% - 13.0% ] 12.76% | 15,190,119 | 6.8% |
[ 13.0% - 13.5% ] 13.24% | 14,770,098 | 6.5% |
[ 13.5% - 14.0% ] 13.74% | 11,671,267 | 7.0% |
[ 14.0% - 14.5% ] 14.24% | 10,138,482 | 7.4% |
[ 14.5% - 15.0% ] 14.74% | 8,816,398 | 7.1% |
[ 15.0% - 15.5% ] 15.24% | 8,193,061 | 6.9% |
[ 15.5% - 16.0% ] 15.75% | 6,634,792 | 6.5% |
[ 16.0% - 16.5% ] 16.25% | 5,501,176 | 7.0% |
[ 16.5% - 17.0% ] 16.74% | 4,371,339 | 6.9% |
[ 17.0% - 17.5% ] 17.25% | 4,403,287 | 7.1% |
[ 17.5% - 18.0% ] 17.74% | 3,996,066 | 7.1% |
[ 18.0% - 18.5% ] 18.25% | 3,686,169 | 6.7% |
[ 18.5% - 19.0% ] 18.74% | 3,361,144 | 6.7% |
[ 19.0% - 19.5% ] 19.27% | 3,007,845 | 7.1% |
[ 19.5% - 20.0% ] 19.76% | 2,835,264 | 6.6% |
[ 20.0% - 20.5% ] 20.22% | 2,640,218 | 6.8% |
[ 20.5% - 21.0% ] 20.74% | 2,017,720 | 6.6% |
[ 21.0% - 21.5% ] 21.26% | 1,837,349 | 7.2% |
[ 21.5% - 22.0% ] 21.74% | 1,714,799 | 6.0% |
[ 22.0% - 22.5% ] 22.27% | 2,025,474 | 7.1% |
[ 22.5% - 23.0% ] 22.75% | 1,439,683 | 7.6% |
[ 23.0% - 23.5% ] 23.27% | 1,381,163 | 6.8% |
[ 23.5% - 24.0% ] 23.76% | 1,040,956 | 7.2% |
[ 24.0% - 24.5% ] 24.26% | 1,158,938 | 7.7% |
[ 24.5% - 25.0% ] 24.73% | 861,555 | 8.5% |
[ 25.0% - 25.5% ] 25.24% | 1,013,160 | 7.8% |
[ 25.5% - 26.0% ] 25.75% | 751,053 | 7.5% |
[ 26.0% - 26.5% ] 26.29% | 695,672 | 6.9% |
[ 26.5% - 27.0% ] 26.76% | 489,423 | 8.1% |
[ 27.0% - 27.5% ] 27.22% | 488,867 | 7.0% |
[ 27.5% - 28.0% ] 27.81% | 478,905 | 8.2% |
[ 28.0% - 28.5% ] 28.24% | 573,793 | 6.9% |
[ 28.5% - 29.0% ] 28.72% | 479,858 | 6.8% |
[ 29.0% - 29.5% ] 29.21% | 349,490 | 7.0% |
[ 29.5% - 30.0% ] 29.70% | 462,176 | 6.6% |
[ 30.0% - 30.5% ] 30.24% | 278,347 | 7.7% |
[ 30.5% - 31.0% ] 30.72% | 269,300 | 6.8% |
[ 31.0% - 31.5% ] 31.32% | 241,122 | 5.6% |
[ 31.5% - 32.0% ] 31.74% | 347,747 | 6.4% |
[ 32.0% - 32.5% ] 32.27% | 181,512 | 7.1% |
[ 32.5% - 33.0% ] 32.80% | 126,765 | 6.0% |
[ 33.0% - 33.5% ] 33.25% | 93,778 | 8.0% |
[ 33.5% - 34.0% ] 33.81% | 151,608 | 7.6% |
[ 34.0% - 34.5% ] 34.23% | 75,953 | 8.6% |
[ 34.5% - 35.0% ] 34.76% | 143,634 | 7.8% |
[ 35.0% - 35.5% ] 35.29% | 99,789 | 5.9% |
[ 35.5% - 36.0% ] 35.70% | 38,950 | 11.1% |
[ 36.0% - 36.5% ] 36.12% | 81,547 | 7.4% |
[ 36.5% - 37.0% ] 36.69% | 36,303 | 7.8% |
[ 37.0% - 37.5% ] 37.15% | 45,807 | 9.5% |
[ 37.5% - 38.0% ] 37.77% | 30,129 | 9.8% |
[ 38.0% - 38.5% ] 38.28% | 40,018 | 7.2% |
[ 38.5% - 39.0% ] 38.64% | 34,354 | 7.3% |
[ 39.0% - 39.5% ] 39.30% | 73,721 | 8.2% |
[ 39.5% - 40.0% ] 39.77% | 39,689 | 9.2% |
[ 40.0% - 40.5% ] 40.11% | 29,013 | 7.5% |
[ 40.5% - 41.0% ] 40.73% | 11,268 | 13.2% |
[ 41.0% - 41.5% ] 41.26% | 18,897 | 5.4% |
[ 41.5% - 42.0% ] 41.74% | 32,751 | 12.4% |
[ 42.0% - 42.5% ] 42.22% | 3,967 | 18.3% |
[ 42.5% - 43.0% ] 42.66% | 10,964 | 11.2% |
[ 43.0% - 43.5% ] 43.23% | 8,159 | 8.8% |
[ 43.5% - 44.0% ] 43.81% | 2,963 | 16.4% |
[ 44.0% - 44.5% ] 44.37% | 6,261 | 19.4% |
[ 44.5% - 45.0% ] 44.74% | 5,704 | 12.5% |
[ 45.0% - 45.5% ] 45.32% | 20,063 | 8.4% |
[ 45.5% - 46.0% ] 45.72% | 1,391 | 6.6% |
[ 46.0% - 46.5% ] 46.24% | 2,370 | 9.5% |
[ 46.5% - 47.0% ] 46.83% | 1,642 | 10.0% |
[ 47.0% - 47.5% ] 47.18% | 16,024 | 7.8% |
[ 47.5% - 48.0% ] 47.86% | 5,487 | 9.5% |
[ 48.0% - 48.5% ] 48.34% | 2,141 | 25.3% |
[ 48.5% - 49.0% ] 48.72% | 1,285 | 23.2% |
[ 49.0% - 49.5% ] 49.12% | 1,641 | 25.5% |
[ 49.5% - 50.0% ] 49.84% | 2,227 | 21.1% |
[ 50.0% - 50.5% ] 50.17% | 875 | 5.0% |
[ 50.5% - 51.0% ] 50.61% | 2,065 | 20.7% |
[ 51.0% - 51.5% ] 51.19% | 842 | 8.7% |
[ 51.5% - 52.0% ] 51.68% | 625 | 26.3% |
[ 52.0% - 52.5% ] 52.16% | 855 | 10.4% |
[ 52.5% - 53.0% ] 52.69% | 2,283 | 8.6% |
[ 53.0% - 53.5% ] 53.26% | 3,038 | 24.6% |
[ 53.5% - 54.0% ] 53.86% | 4,376 | 11.3% |
[ 54.0% - 54.5% ] 54.19% | 1,218 | 5.9% |
[ 54.5% - 55.0% ] 54.86% | 1,039 | 2.8% |
[ 55.0% - 55.5% ] 55.27% | 2,620 | 10.1% |
[ 55.5% - 56.0% ] 55.75% | 1,114 | 12.4% |
[ 56.0% - 56.5% ] 56.19% | 1,358 | 5.4% |
[ 56.5% - 57.0% ] 56.77% | 229 | 33.1% |
[ 57.0% - 57.5% ] 57.19% | 292 | 16.4% |
[ 57.5% - 58.0% ] 57.77% | 1,402 | 41.7% |
[ 58.0% - 58.5% ] 58.21% | 268 | 31.2% |
[ 59.0% - 59.5% ] 59.35% | 123 | 23.6% |
[ 59.5% - 60.0% ] 59.61% | 812 | 18.9% |
[ 60.5% - 61.0% ] 60.74% | 298 | 24.3% |
[ 61.0% - 61.5% ] 61.17% | 958 | 18.4% |
[ 61.5% - 62.0% ] 61.65% | 1,330 | 25.0% |
[ 62.0% - 62.5% ] 62.33% | 791 | 21.7% |
[ 62.5% - 63.0% ] 62.71% | 1,534 | 9.8% |
[ 63.5% - 64.0% ] 63.51% | 74 | 31.6% |
[ 64.5% - 65.0% ] 64.79% | 622 | 19.9% |
[ 65.5% - 66.0% ] 65.91% | 88 | 15.6% |
[ 66.0% - 66.5% ] 66.35% | 315 | 69.4% |
[ 67.0% - 67.5% ] 67.17% | 265 | 35.2% |
[ 68.0% - 68.5% ] 68.17% | 311 | 69.6% |
[ 68.5% - 69.0% ] 68.86% | 1,034 | 20.1% |
[ 69.5% - 70.0% ] 69.90% | 103 | 8.5% |
[ 70.5% - 71.0% ] 70.87% | 690 | 9.1% |
[ 71.5% - 72.0% ] 71.88% | 32 | 30.0% |
[ 72.0% - 72.5% ] 72.11% | 190 | 12.6% |
[ 72.5% - 73.0% ] 72.73% | 66 | 40.0% |
[ 73.0% - 73.5% ] 73.21% | 56 | 76.5% |
[ 73.5% - 74.0% ] 73.68% | 19 | 50.0% |
[ 75.0% - 75.5% ] 75.00% | 228 | 17.3% |
[ 75.0% - 75.5% ] 75.42% | 240 | 57.5% |
[ 76.0% - 76.5% ] 76.47% | 17 | 11.1% |
[ 76.5% - 77.0% ] 76.57% | 239 | 73.6% |
[ 77.5% - 78.0% ] 77.78% | 72 | 22.1% |
[ 78.0% - 78.5% ] 78.05% | 82 | 47.4% |
[ 80.0% - 80.5% ] 80.08% | 502 | 16.4% |
[ 80.5% - 81.0% ] 80.95% | 21 | 57.1% |
[ 93.0% - 93.5% ] 93.48% | 138 | 19.7% |