Irish College, 1 year or more
COMPARE
Irish
Select to Compare
College, 1 year or more
Irish College, 1 year or more
59.6%
COLLEGE, 1 YEAR OR MORE
56.1/ 100
METRIC RATING
165th/ 347
METRIC RANK
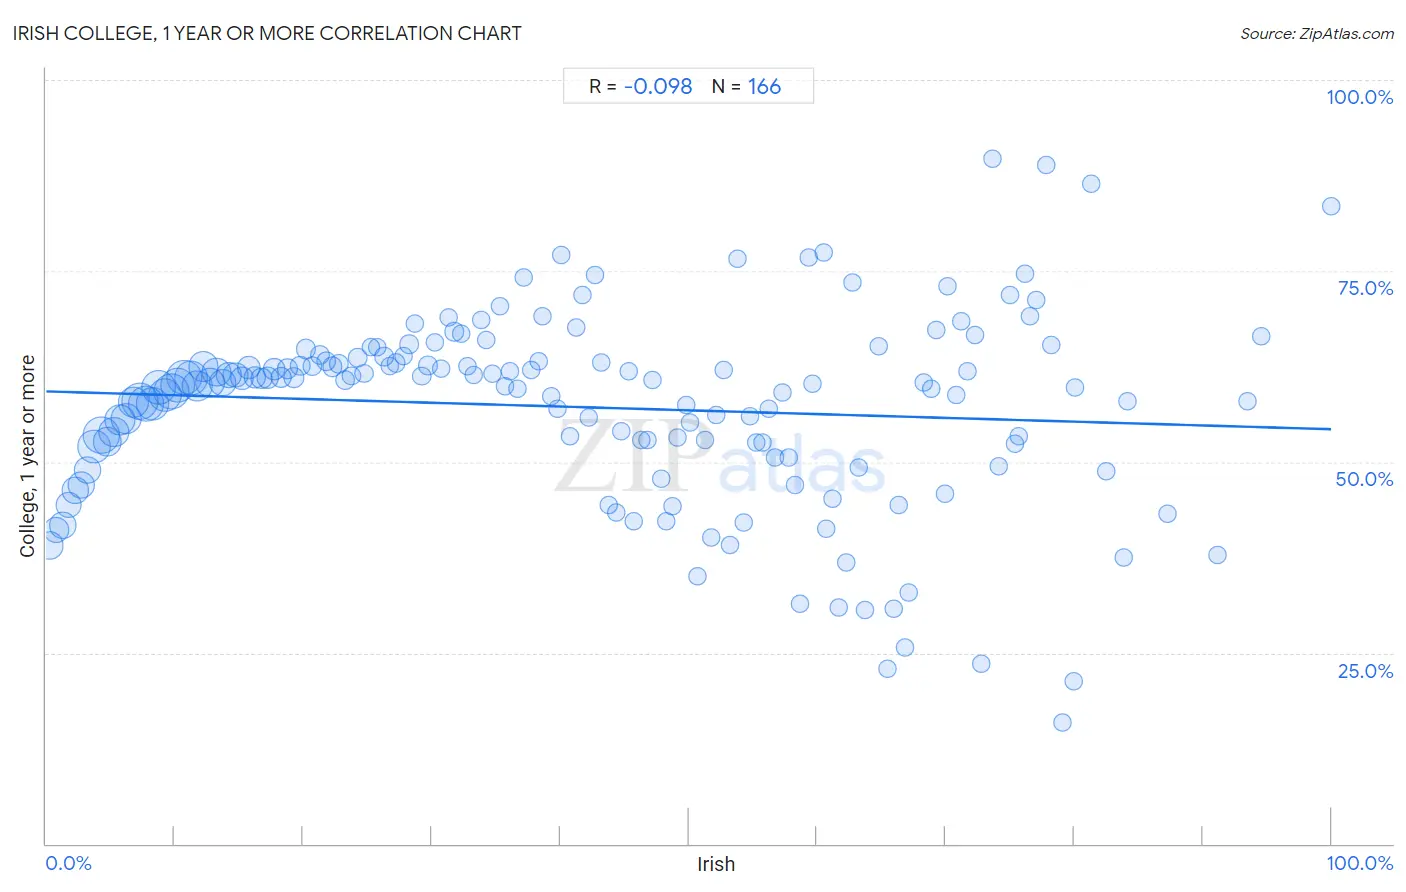
Irish College, 1 year or more Correlation Chart
The statistical analysis conducted on geographies consisting of 580,683,064 people shows a slight negative correlation between the proportion of Irish and percentage of population with at least college, 1 year or more education in the United States with a correlation coefficient (R) of -0.098 and weighted average of 59.6%. On average, for every 1% (one percent) increase in Irish within a typical geography, there is a decrease of 0.050% in percentage of population with at least college, 1 year or more education.
It is essential to understand that the correlation between the percentage of Irish and percentage of population with at least college, 1 year or more education does not imply a direct cause-and-effect relationship. It remains uncertain whether the presence of Irish influences an upward or downward trend in the level of percentage of population with at least college, 1 year or more education within an area, or if Irish simply ended up residing in those areas with higher or lower levels of percentage of population with at least college, 1 year or more education due to other factors.
Demographics Similar to Irish by College, 1 year or more
In terms of college, 1 year or more, the demographic groups most similar to Irish are Immigrants from Africa (59.6%, a difference of 0.0%), Belgian (59.7%, a difference of 0.11%), Immigrants from Somalia (59.7%, a difference of 0.12%), Korean (59.7%, a difference of 0.13%), and Immigrants from North Macedonia (59.5%, a difference of 0.16%).
| Demographics | Rating | Rank | College, 1 year or more |
| English | 67.2 /100 | #158 | Good 60.0% |
| Immigrants from Iraq | 67.0 /100 | #159 | Good 60.0% |
| South American Indians | 66.9 /100 | #160 | Good 60.0% |
| Somalis | 64.5 /100 | #161 | Good 59.9% |
| Koreans | 58.5 /100 | #162 | Average 59.7% |
| Immigrants from Somalia | 58.3 /100 | #163 | Average 59.7% |
| Belgians | 58.1 /100 | #164 | Average 59.7% |
| Irish | 56.1 /100 | #165 | Average 59.6% |
| Immigrants from Africa | 56.1 /100 | #166 | Average 59.6% |
| Immigrants from North Macedonia | 53.1 /100 | #167 | Average 59.5% |
| Hungarians | 52.9 /100 | #168 | Average 59.5% |
| Immigrants from Southern Europe | 52.7 /100 | #169 | Average 59.5% |
| Welsh | 52.4 /100 | #170 | Average 59.5% |
| Immigrants from Albania | 52.3 /100 | #171 | Average 59.5% |
| Immigrants from Sierra Leone | 52.2 /100 | #172 | Average 59.5% |
Irish College, 1 year or more Correlation Summary
| Measurement | Irish Data | College, 1 year or more Data |
| Minimum | 0.26% | 16.0% |
| Maximum | 100.0% | 89.7% |
| Range | 99.7% | 73.7% |
| Mean | 42.1% | 57.1% |
| Median | 41.5% | 60.3% |
| Interquartile 25% (IQ1) | 20.7% | 52.0% |
| Interquartile 75% (IQ3) | 62.3% | 63.2% |
| Interquartile Range (IQR) | 41.5% | 11.2% |
| Standard Deviation (Sample) | 25.1% | 12.7% |
| Standard Deviation (Population) | 25.0% | 12.6% |
Correlation Details
| Irish Percentile | Sample Size | College, 1 year or more |
[ 0.0% - 0.5% ] 0.26% | 12,566,608 | 39.1% |
[ 0.5% - 1.0% ] 0.73% | 10,459,989 | 41.0% |
[ 1.0% - 1.5% ] 1.26% | 11,279,875 | 41.7% |
[ 1.5% - 2.0% ] 1.76% | 10,705,731 | 44.4% |
[ 2.0% - 2.5% ] 2.26% | 11,171,204 | 46.2% |
[ 2.5% - 3.0% ] 2.74% | 12,074,867 | 46.9% |
[ 3.0% - 3.5% ] 3.25% | 11,969,995 | 49.0% |
[ 3.5% - 4.0% ] 3.71% | 19,940,448 | 52.0% |
[ 4.0% - 4.5% ] 4.30% | 25,466,159 | 53.5% |
[ 4.5% - 5.0% ] 4.74% | 14,394,838 | 52.6% |
[ 5.0% - 5.5% ] 5.24% | 16,881,408 | 53.9% |
[ 5.5% - 6.0% ] 5.74% | 17,493,683 | 55.5% |
[ 6.0% - 6.5% ] 6.25% | 17,551,570 | 55.6% |
[ 6.5% - 7.0% ] 6.76% | 18,006,500 | 57.8% |
[ 7.0% - 7.5% ] 7.25% | 25,864,748 | 58.0% |
[ 7.5% - 8.0% ] 7.75% | 24,527,150 | 57.6% |
[ 8.0% - 8.5% ] 8.26% | 20,671,441 | 57.6% |
[ 8.5% - 9.0% ] 8.73% | 22,697,794 | 59.7% |
[ 9.0% - 9.5% ] 9.25% | 20,621,893 | 58.8% |
[ 9.5% - 10.0% ] 9.75% | 23,743,641 | 59.2% |
[ 10.0% - 10.5% ] 10.24% | 21,956,494 | 60.1% |
[ 10.5% - 11.0% ] 10.74% | 22,726,013 | 61.1% |
[ 11.0% - 11.5% ] 11.26% | 21,176,645 | 61.0% |
[ 11.5% - 12.0% ] 11.76% | 18,043,327 | 59.9% |
[ 12.0% - 12.5% ] 12.23% | 16,448,928 | 62.5% |
[ 12.5% - 13.0% ] 12.76% | 15,293,572 | 60.3% |
[ 13.0% - 13.5% ] 13.24% | 14,827,621 | 61.7% |
[ 13.5% - 14.0% ] 13.74% | 11,729,385 | 60.3% |
[ 14.0% - 14.5% ] 14.24% | 10,205,100 | 61.3% |
[ 14.5% - 15.0% ] 14.74% | 8,859,543 | 61.4% |
[ 15.0% - 15.5% ] 15.24% | 8,239,051 | 61.0% |
[ 15.5% - 16.0% ] 15.75% | 6,708,014 | 62.3% |
[ 16.0% - 16.5% ] 16.25% | 5,550,769 | 61.1% |
[ 16.5% - 17.0% ] 16.74% | 4,416,461 | 60.9% |
[ 17.0% - 17.5% ] 17.25% | 4,447,871 | 61.0% |
[ 17.5% - 18.0% ] 17.74% | 4,029,925 | 62.2% |
[ 18.0% - 18.5% ] 18.25% | 3,705,047 | 61.1% |
[ 18.5% - 19.0% ] 18.74% | 3,404,893 | 62.1% |
[ 19.0% - 19.5% ] 19.27% | 3,041,569 | 61.0% |
[ 19.5% - 20.0% ] 19.76% | 2,856,834 | 62.6% |
[ 20.0% - 20.5% ] 20.22% | 2,676,154 | 64.8% |
[ 20.5% - 21.0% ] 20.74% | 2,040,543 | 62.5% |
[ 21.0% - 21.5% ] 21.26% | 1,852,856 | 64.0% |
[ 21.5% - 22.0% ] 21.74% | 1,733,102 | 63.2% |
[ 22.0% - 22.5% ] 22.27% | 2,032,033 | 62.4% |
[ 22.5% - 23.0% ] 22.75% | 1,457,215 | 62.8% |
[ 23.0% - 23.5% ] 23.27% | 1,405,795 | 60.8% |
[ 23.5% - 24.0% ] 23.76% | 1,052,902 | 61.3% |
[ 24.0% - 24.5% ] 24.26% | 1,166,875 | 63.7% |
[ 24.5% - 25.0% ] 24.73% | 876,945 | 61.5% |
[ 25.0% - 25.5% ] 25.24% | 1,029,106 | 65.1% |
[ 25.5% - 26.0% ] 25.76% | 760,091 | 65.0% |
[ 26.0% - 26.5% ] 26.29% | 706,449 | 63.8% |
[ 26.5% - 27.0% ] 26.76% | 504,485 | 62.5% |
[ 27.0% - 27.5% ] 27.22% | 497,625 | 62.9% |
[ 27.5% - 28.0% ] 27.80% | 492,372 | 63.9% |
[ 28.0% - 28.5% ] 28.24% | 579,218 | 65.4% |
[ 28.5% - 29.0% ] 28.72% | 483,318 | 68.1% |
[ 29.0% - 29.5% ] 29.22% | 354,398 | 61.2% |
[ 29.5% - 30.0% ] 29.70% | 465,265 | 62.6% |
[ 30.0% - 30.5% ] 30.24% | 286,430 | 65.7% |
[ 30.5% - 31.0% ] 30.72% | 271,310 | 62.3% |
[ 31.0% - 31.5% ] 31.32% | 242,646 | 69.0% |
[ 31.5% - 32.0% ] 31.74% | 354,001 | 67.0% |
[ 32.0% - 32.5% ] 32.27% | 185,754 | 66.7% |
[ 32.5% - 33.0% ] 32.80% | 128,549 | 62.5% |
[ 33.0% - 33.5% ] 33.25% | 95,946 | 61.4% |
[ 33.5% - 34.0% ] 33.81% | 152,608 | 68.7% |
[ 34.0% - 34.5% ] 34.23% | 78,145 | 66.0% |
[ 34.5% - 35.0% ] 34.76% | 146,584 | 61.6% |
[ 35.0% - 35.5% ] 35.29% | 103,702 | 70.4% |
[ 35.5% - 36.0% ] 35.70% | 40,064 | 59.9% |
[ 36.0% - 36.5% ] 36.12% | 83,557 | 61.9% |
[ 36.5% - 37.0% ] 36.70% | 41,885 | 59.5% |
[ 37.0% - 37.5% ] 37.15% | 46,836 | 74.1% |
[ 37.5% - 38.0% ] 37.77% | 31,606 | 62.0% |
[ 38.0% - 38.5% ] 38.28% | 41,739 | 63.2% |
[ 38.5% - 39.0% ] 38.65% | 35,329 | 69.1% |
[ 39.0% - 39.5% ] 39.30% | 76,172 | 58.7% |
[ 39.5% - 40.0% ] 39.77% | 40,777 | 56.9% |
[ 40.0% - 40.5% ] 40.11% | 29,933 | 77.0% |
[ 40.5% - 41.0% ] 40.74% | 13,064 | 53.4% |
[ 41.0% - 41.5% ] 41.26% | 19,715 | 67.6% |
[ 41.5% - 42.0% ] 41.74% | 34,672 | 71.8% |
[ 42.0% - 42.5% ] 42.22% | 4,671 | 55.8% |
[ 42.5% - 43.0% ] 42.67% | 11,554 | 74.4% |
[ 43.0% - 43.5% ] 43.23% | 10,235 | 63.1% |
[ 43.5% - 44.0% ] 43.80% | 3,619 | 44.3% |
[ 44.0% - 44.5% ] 44.35% | 8,300 | 43.3% |
[ 44.5% - 45.0% ] 44.72% | 6,529 | 54.0% |
[ 45.0% - 45.5% ] 45.31% | 21,157 | 61.8% |
[ 45.5% - 46.0% ] 45.70% | 3,667 | 42.2% |
[ 46.0% - 46.5% ] 46.26% | 3,930 | 52.9% |
[ 46.5% - 47.0% ] 46.79% | 2,090 | 52.9% |
[ 47.0% - 47.5% ] 47.19% | 17,526 | 60.6% |
[ 47.5% - 48.0% ] 47.86% | 7,467 | 47.7% |
[ 48.0% - 48.5% ] 48.27% | 3,673 | 42.2% |
[ 48.5% - 49.0% ] 48.75% | 1,516 | 44.2% |
[ 49.0% - 49.5% ] 49.13% | 2,021 | 53.2% |
[ 49.5% - 50.0% ] 49.83% | 3,737 | 57.4% |
[ 50.0% - 50.5% ] 50.14% | 2,934 | 55.2% |
[ 50.5% - 51.0% ] 50.70% | 3,420 | 35.0% |
[ 51.0% - 51.5% ] 51.22% | 2,335 | 52.8% |
[ 51.5% - 52.0% ] 51.77% | 1,833 | 40.1% |
[ 52.0% - 52.5% ] 52.19% | 1,533 | 56.2% |
[ 52.5% - 53.0% ] 52.72% | 4,086 | 62.0% |
[ 53.0% - 53.5% ] 53.24% | 4,309 | 39.2% |
[ 53.5% - 54.0% ] 53.84% | 5,797 | 76.7% |
[ 54.0% - 54.5% ] 54.24% | 1,674 | 42.1% |
[ 54.5% - 55.0% ] 54.79% | 1,971 | 56.1% |
[ 55.0% - 55.5% ] 55.28% | 3,108 | 52.5% |
[ 55.5% - 56.0% ] 55.70% | 1,984 | 52.5% |
[ 56.0% - 56.5% ] 56.23% | 1,677 | 57.0% |
[ 56.5% - 57.0% ] 56.73% | 691 | 50.5% |
[ 57.0% - 57.5% ] 57.25% | 655 | 59.1% |
[ 57.5% - 58.0% ] 57.77% | 1,596 | 50.6% |
[ 58.0% - 58.5% ] 58.22% | 1,204 | 47.0% |
[ 58.5% - 59.0% ] 58.62% | 145 | 31.5% |
[ 59.0% - 59.5% ] 59.30% | 882 | 76.8% |
[ 59.5% - 60.0% ] 59.61% | 1,035 | 60.2% |
[ 60.0% - 60.5% ] 60.48% | 124 | 77.4% |
[ 60.5% - 61.0% ] 60.71% | 425 | 41.3% |
[ 61.0% - 61.5% ] 61.17% | 1,705 | 45.2% |
[ 61.5% - 62.0% ] 61.68% | 1,516 | 30.9% |
[ 62.0% - 62.5% ] 62.26% | 1,166 | 36.8% |
[ 62.5% - 63.0% ] 62.73% | 1,988 | 73.5% |
[ 63.0% - 63.5% ] 63.20% | 1,280 | 49.2% |
[ 63.5% - 64.0% ] 63.73% | 874 | 30.6% |
[ 64.5% - 65.0% ] 64.77% | 1,039 | 65.1% |
[ 65.0% - 65.5% ] 65.45% | 110 | 22.9% |
[ 65.5% - 66.0% ] 65.92% | 179 | 30.7% |
[ 66.0% - 66.5% ] 66.31% | 555 | 44.3% |
[ 66.5% - 67.0% ] 66.84% | 1,134 | 25.7% |
[ 67.0% - 67.5% ] 67.15% | 551 | 32.9% |
[ 68.0% - 68.5% ] 68.26% | 690 | 60.3% |
[ 68.5% - 69.0% ] 68.86% | 1,095 | 59.6% |
[ 69.0% - 69.5% ] 69.26% | 875 | 67.2% |
[ 69.5% - 70.0% ] 69.92% | 123 | 45.8% |
[ 70.0% - 70.5% ] 70.11% | 87 | 73.1% |
[ 70.5% - 71.0% ] 70.86% | 707 | 58.7% |
[ 71.0% - 71.5% ] 71.22% | 139 | 68.3% |
[ 71.5% - 72.0% ] 71.69% | 219 | 61.9% |
[ 72.0% - 72.5% ] 72.24% | 670 | 66.6% |
[ 72.5% - 73.0% ] 72.78% | 158 | 23.5% |
[ 73.5% - 74.0% ] 73.59% | 390 | 89.7% |
[ 74.0% - 74.5% ] 74.13% | 286 | 49.5% |
[ 75.0% - 75.5% ] 75.00% | 292 | 71.9% |
[ 75.0% - 75.5% ] 75.40% | 187 | 52.3% |
[ 75.5% - 76.0% ] 75.68% | 37 | 53.3% |
[ 76.0% - 76.5% ] 76.21% | 1,177 | 74.7% |
[ 76.5% - 77.0% ] 76.57% | 239 | 69.0% |
[ 77.0% - 77.5% ] 77.01% | 174 | 71.2% |
[ 77.5% - 78.0% ] 77.78% | 72 | 88.9% |
[ 78.0% - 78.5% ] 78.18% | 165 | 65.2% |
[ 79.0% - 79.5% ] 79.12% | 182 | 16.0% |
[ 80.0% - 80.5% ] 80.00% | 230 | 21.3% |
[ 80.0% - 80.5% ] 80.08% | 502 | 59.8% |
[ 81.0% - 81.5% ] 81.36% | 59 | 86.4% |
[ 82.0% - 82.5% ] 82.50% | 120 | 48.8% |
[ 83.5% - 84.0% ] 83.87% | 31 | 37.5% |
[ 84.0% - 84.5% ] 84.10% | 283 | 57.9% |
[ 87.0% - 87.5% ] 87.22% | 133 | 43.2% |
[ 91.0% - 91.5% ] 91.15% | 226 | 37.8% |
[ 93.0% - 93.5% ] 93.48% | 138 | 58.0% |
[ 94.5% - 95.0% ] 94.51% | 510 | 66.5% |
[ 99.5% - 100.0% ] 100.00% | 1,286 | 83.5% |