Irish Disability
COMPARE
Irish
Select to Compare
Disability
Irish Disability
12.9%
DISABILITY
0.0/ 100
METRIC RATING
283rd/ 347
METRIC RANK
Irish Disability Correlation Chart
The statistical analysis conducted on geographies consisting of 580,478,993 people shows a moderate positive correlation between the proportion of Irish and percentage of population with a disability in the United States with a correlation coefficient (R) of 0.483 and weighted average of 12.9%. On average, for every 1% (one percent) increase in Irish within a typical geography, there is an increase of 0.20% in percentage of population with a disability.
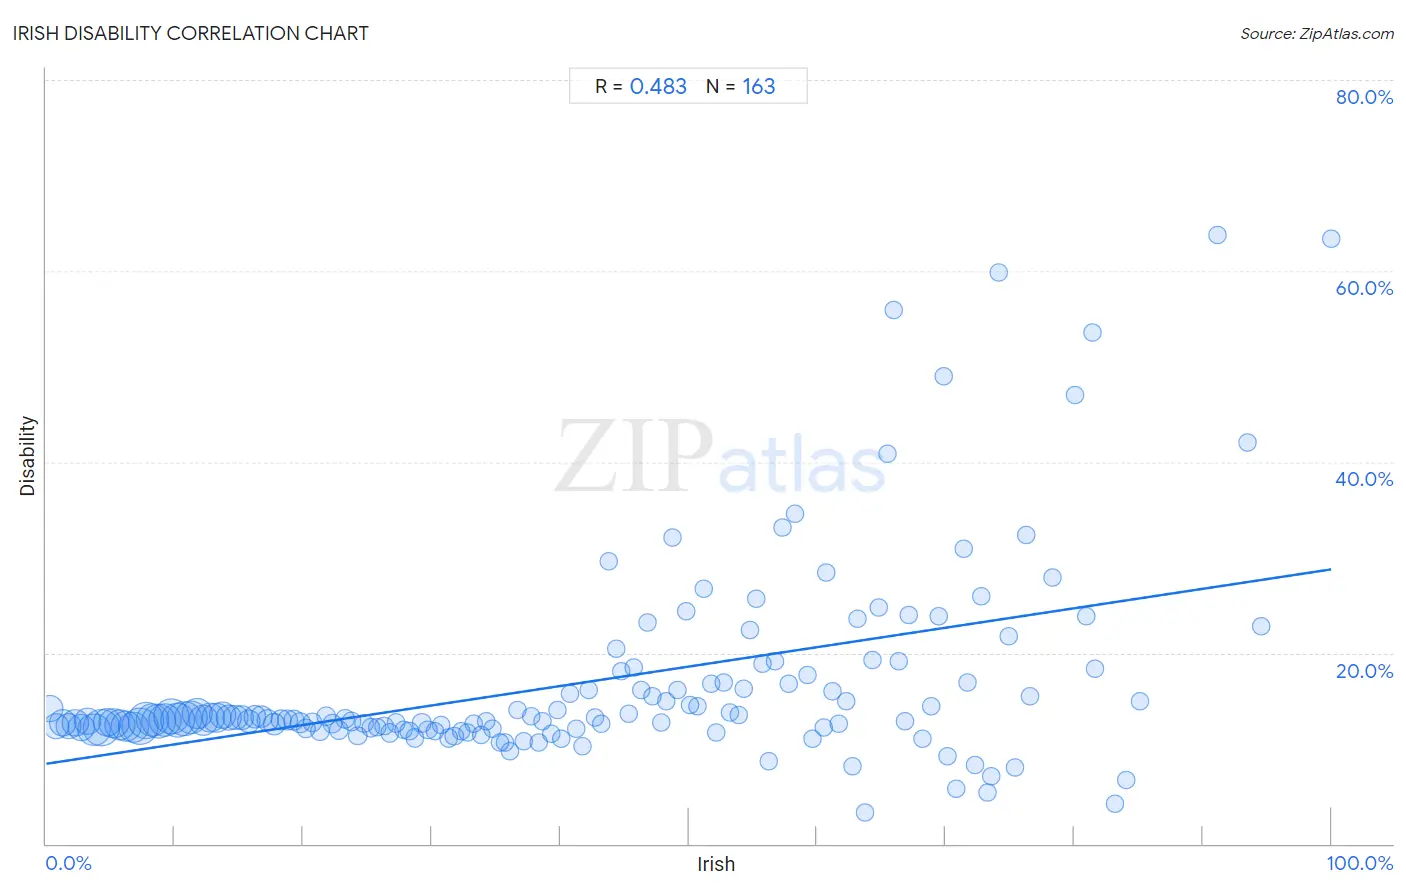
It is essential to understand that the correlation between the percentage of Irish and percentage of population with a disability does not imply a direct cause-and-effect relationship. It remains uncertain whether the presence of Irish influences an upward or downward trend in the level of percentage of population with a disability within an area, or if Irish simply ended up residing in those areas with higher or lower levels of percentage of population with a disability due to other factors.
Demographics Similar to Irish by Disability
In terms of disability, the demographic groups most similar to Irish are Scottish (12.9%, a difference of 0.020%), Immigrants from Portugal (12.9%, a difference of 0.16%), Welsh (12.9%, a difference of 0.19%), Crow (12.9%, a difference of 0.20%), and Spanish (12.8%, a difference of 0.30%).
| Demographics | Rating | Rank | Disability |
| Hmong | 0.0 /100 | #276 | Tragic 12.8% |
| Dutch | 0.0 /100 | #277 | Tragic 12.8% |
| Germans | 0.0 /100 | #278 | Tragic 12.8% |
| Fijians | 0.0 /100 | #279 | Tragic 12.8% |
| Spanish | 0.0 /100 | #280 | Tragic 12.8% |
| Immigrants from Portugal | 0.0 /100 | #281 | Tragic 12.9% |
| Scottish | 0.0 /100 | #282 | Tragic 12.9% |
| Irish | 0.0 /100 | #283 | Tragic 12.9% |
| Welsh | 0.0 /100 | #284 | Tragic 12.9% |
| Crow | 0.0 /100 | #285 | Tragic 12.9% |
| English | 0.0 /100 | #286 | Tragic 13.0% |
| Africans | 0.0 /100 | #287 | Tragic 13.0% |
| Whites/Caucasians | 0.0 /100 | #288 | Tragic 13.0% |
| Slovaks | 0.0 /100 | #289 | Tragic 13.0% |
| Cheyenne | 0.0 /100 | #290 | Tragic 13.0% |
Irish Disability Correlation Summary
| Measurement | Irish Data | Disability Data |
| Minimum | 0.26% | 3.2% |
| Maximum | 100.0% | 63.7% |
| Range | 99.7% | 60.5% |
| Mean | 41.5% | 16.8% |
| Median | 40.7% | 13.0% |
| Interquartile 25% (IQ1) | 20.2% | 12.2% |
| Interquartile 75% (IQ3) | 61.7% | 16.9% |
| Interquartile Range (IQR) | 41.5% | 4.7% |
| Standard Deviation (Sample) | 24.8% | 10.5% |
| Standard Deviation (Population) | 24.7% | 10.4% |
Correlation Details
| Irish Percentile | Sample Size | Disability |
[ 0.0% - 0.5% ] 0.26% | 12,566,287 | 14.2% |
[ 0.5% - 1.0% ] 0.73% | 10,457,631 | 12.4% |
[ 1.0% - 1.5% ] 1.26% | 11,270,589 | 12.7% |
[ 1.5% - 2.0% ] 1.76% | 10,700,495 | 12.3% |
[ 2.0% - 2.5% ] 2.26% | 11,151,279 | 12.7% |
[ 2.5% - 3.0% ] 2.74% | 12,072,346 | 12.2% |
[ 3.0% - 3.5% ] 3.25% | 11,964,953 | 12.9% |
[ 3.5% - 4.0% ] 3.71% | 19,933,903 | 11.9% |
[ 4.0% - 4.5% ] 4.30% | 25,461,862 | 12.2% |
[ 4.5% - 5.0% ] 4.74% | 14,391,099 | 12.7% |
[ 5.0% - 5.5% ] 5.24% | 16,874,715 | 12.6% |
[ 5.5% - 6.0% ] 5.74% | 17,488,025 | 12.5% |
[ 6.0% - 6.5% ] 6.25% | 17,537,999 | 12.3% |
[ 6.5% - 7.0% ] 6.76% | 17,999,749 | 12.2% |
[ 7.0% - 7.5% ] 7.25% | 25,860,848 | 12.3% |
[ 7.5% - 8.0% ] 7.75% | 24,530,610 | 12.9% |
[ 8.0% - 8.5% ] 8.26% | 20,667,804 | 13.0% |
[ 8.5% - 9.0% ] 8.73% | 22,694,901 | 12.9% |
[ 9.0% - 9.5% ] 9.25% | 20,613,008 | 13.0% |
[ 9.5% - 10.0% ] 9.75% | 23,738,802 | 13.3% |
[ 10.0% - 10.5% ] 10.24% | 21,951,516 | 13.0% |
[ 10.5% - 11.0% ] 10.74% | 22,718,913 | 13.1% |
[ 11.0% - 11.5% ] 11.26% | 21,178,467 | 13.3% |
[ 11.5% - 12.0% ] 11.76% | 18,014,014 | 13.6% |
[ 12.0% - 12.5% ] 12.23% | 16,444,881 | 12.9% |
[ 12.5% - 13.0% ] 12.76% | 15,294,421 | 13.3% |
[ 13.0% - 13.5% ] 13.24% | 14,821,573 | 13.2% |
[ 13.5% - 14.0% ] 13.74% | 11,726,623 | 13.5% |
[ 14.0% - 14.5% ] 14.24% | 10,204,819 | 13.2% |
[ 14.5% - 15.0% ] 14.74% | 8,858,097 | 13.2% |
[ 15.0% - 15.5% ] 15.24% | 8,234,815 | 13.2% |
[ 15.5% - 16.0% ] 15.75% | 6,709,288 | 12.8% |
[ 16.0% - 16.5% ] 16.25% | 5,550,663 | 13.3% |
[ 16.5% - 17.0% ] 16.74% | 4,415,041 | 13.3% |
[ 17.0% - 17.5% ] 17.25% | 4,445,227 | 13.0% |
[ 17.5% - 18.0% ] 17.74% | 4,029,076 | 12.5% |
[ 18.0% - 18.5% ] 18.25% | 3,704,328 | 12.9% |
[ 18.5% - 19.0% ] 18.74% | 3,396,876 | 13.0% |
[ 19.0% - 19.5% ] 19.27% | 3,040,819 | 12.9% |
[ 19.5% - 20.0% ] 19.76% | 2,855,467 | 12.7% |
[ 20.0% - 20.5% ] 20.22% | 2,675,702 | 12.1% |
[ 20.5% - 21.0% ] 20.74% | 2,039,659 | 12.7% |
[ 21.0% - 21.5% ] 21.26% | 1,854,646 | 11.7% |
[ 21.5% - 22.0% ] 21.74% | 1,730,935 | 13.3% |
[ 22.0% - 22.5% ] 22.27% | 2,031,394 | 12.6% |
[ 22.5% - 23.0% ] 22.75% | 1,457,038 | 11.9% |
[ 23.0% - 23.5% ] 23.27% | 1,403,897 | 13.0% |
[ 23.5% - 24.0% ] 23.76% | 1,052,264 | 12.8% |
[ 24.0% - 24.5% ] 24.26% | 1,166,279 | 11.3% |
[ 24.5% - 25.0% ] 24.73% | 877,895 | 12.6% |
[ 25.0% - 25.5% ] 25.24% | 1,028,775 | 12.2% |
[ 25.5% - 26.0% ] 25.76% | 759,568 | 12.2% |
[ 26.0% - 26.5% ] 26.29% | 705,640 | 12.4% |
[ 26.5% - 27.0% ] 26.76% | 503,747 | 11.6% |
[ 27.0% - 27.5% ] 27.22% | 498,782 | 12.7% |
[ 27.5% - 28.0% ] 27.80% | 492,196 | 11.9% |
[ 28.0% - 28.5% ] 28.24% | 578,854 | 11.8% |
[ 28.5% - 29.0% ] 28.72% | 485,309 | 11.1% |
[ 29.0% - 29.5% ] 29.22% | 354,113 | 12.6% |
[ 29.5% - 30.0% ] 29.70% | 464,343 | 12.0% |
[ 30.0% - 30.5% ] 30.24% | 286,483 | 11.8% |
[ 30.5% - 31.0% ] 30.72% | 271,009 | 12.4% |
[ 31.0% - 31.5% ] 31.32% | 242,376 | 11.1% |
[ 31.5% - 32.0% ] 31.74% | 354,055 | 11.3% |
[ 32.0% - 32.5% ] 32.27% | 185,404 | 11.8% |
[ 32.5% - 33.0% ] 32.80% | 128,387 | 11.7% |
[ 33.0% - 33.5% ] 33.25% | 95,859 | 12.6% |
[ 33.5% - 34.0% ] 33.81% | 151,938 | 11.4% |
[ 34.0% - 34.5% ] 34.23% | 78,107 | 12.8% |
[ 34.5% - 35.0% ] 34.76% | 146,371 | 12.0% |
[ 35.0% - 35.5% ] 35.29% | 103,440 | 10.6% |
[ 35.5% - 36.0% ] 35.70% | 39,447 | 10.6% |
[ 36.0% - 36.5% ] 36.12% | 82,908 | 9.7% |
[ 36.5% - 37.0% ] 36.70% | 41,547 | 14.0% |
[ 37.0% - 37.5% ] 37.15% | 47,033 | 10.8% |
[ 37.5% - 38.0% ] 37.77% | 31,447 | 13.3% |
[ 38.0% - 38.5% ] 38.28% | 41,525 | 10.6% |
[ 38.5% - 39.0% ] 38.64% | 35,254 | 12.8% |
[ 39.0% - 39.5% ] 39.30% | 75,968 | 11.5% |
[ 39.5% - 40.0% ] 39.77% | 40,737 | 14.0% |
[ 40.0% - 40.5% ] 40.11% | 29,891 | 10.9% |
[ 40.5% - 41.0% ] 40.73% | 12,638 | 15.7% |
[ 41.0% - 41.5% ] 41.26% | 19,070 | 12.0% |
[ 41.5% - 42.0% ] 41.73% | 34,300 | 10.2% |
[ 42.0% - 42.5% ] 42.22% | 4,074 | 16.0% |
[ 42.5% - 43.0% ] 42.67% | 11,505 | 13.3% |
[ 43.0% - 43.5% ] 43.23% | 10,184 | 12.6% |
[ 43.5% - 44.0% ] 43.80% | 3,411 | 29.6% |
[ 44.0% - 44.5% ] 44.36% | 7,761 | 20.4% |
[ 44.5% - 45.0% ] 44.74% | 6,880 | 18.1% |
[ 45.0% - 45.5% ] 45.31% | 21,077 | 13.6% |
[ 45.5% - 46.0% ] 45.70% | 3,427 | 18.4% |
[ 46.0% - 46.5% ] 46.26% | 3,928 | 16.1% |
[ 46.5% - 47.0% ] 46.79% | 2,058 | 23.1% |
[ 47.0% - 47.5% ] 47.19% | 17,235 | 15.4% |
[ 47.5% - 48.0% ] 47.87% | 7,477 | 12.7% |
[ 48.0% - 48.5% ] 48.29% | 3,365 | 14.9% |
[ 48.5% - 49.0% ] 48.74% | 1,551 | 32.1% |
[ 49.0% - 49.5% ] 49.12% | 1,810 | 16.1% |
[ 49.5% - 50.0% ] 49.83% | 3,317 | 24.3% |
[ 50.0% - 50.5% ] 50.12% | 2,600 | 14.6% |
[ 50.5% - 51.0% ] 50.70% | 3,420 | 14.4% |
[ 51.0% - 51.5% ] 51.20% | 2,242 | 26.7% |
[ 51.5% - 52.0% ] 51.77% | 1,698 | 16.8% |
[ 52.0% - 52.5% ] 52.19% | 1,533 | 11.6% |
[ 52.5% - 53.0% ] 52.72% | 4,067 | 16.9% |
[ 53.0% - 53.5% ] 53.24% | 4,309 | 13.8% |
[ 53.5% - 54.0% ] 53.85% | 4,943 | 13.5% |
[ 54.0% - 54.5% ] 54.24% | 1,650 | 16.2% |
[ 54.5% - 55.0% ] 54.81% | 1,620 | 22.3% |
[ 55.0% - 55.5% ] 55.28% | 3,137 | 25.6% |
[ 55.5% - 56.0% ] 55.71% | 1,759 | 18.9% |
[ 56.0% - 56.5% ] 56.23% | 1,677 | 8.6% |
[ 56.5% - 57.0% ] 56.67% | 487 | 19.1% |
[ 57.0% - 57.5% ] 57.25% | 655 | 33.1% |
[ 57.5% - 58.0% ] 57.79% | 1,450 | 16.8% |
[ 58.0% - 58.5% ] 58.25% | 824 | 34.6% |
[ 59.0% - 59.5% ] 59.27% | 464 | 17.7% |
[ 59.5% - 60.0% ] 59.63% | 1,085 | 11.0% |
[ 60.0% - 60.5% ] 60.47% | 296 | 12.2% |
[ 60.5% - 61.0% ] 60.71% | 425 | 28.5% |
[ 61.0% - 61.5% ] 61.17% | 1,705 | 16.0% |
[ 61.5% - 62.0% ] 61.68% | 1,516 | 12.6% |
[ 62.0% - 62.5% ] 62.26% | 1,142 | 15.0% |
[ 62.5% - 63.0% ] 62.73% | 2,093 | 8.1% |
[ 63.0% - 63.5% ] 63.13% | 2,048 | 23.5% |
[ 63.5% - 64.0% ] 63.73% | 863 | 3.2% |
[ 64.0% - 64.5% ] 64.31% | 311 | 19.3% |
[ 64.5% - 65.0% ] 64.78% | 690 | 24.7% |
[ 65.0% - 65.5% ] 65.45% | 110 | 40.9% |
[ 65.5% - 66.0% ] 65.92% | 179 | 55.9% |
[ 66.0% - 66.5% ] 66.31% | 555 | 19.1% |
[ 66.5% - 67.0% ] 66.84% | 1,125 | 12.8% |
[ 67.0% - 67.5% ] 67.15% | 551 | 24.0% |
[ 68.0% - 68.5% ] 68.21% | 453 | 11.0% |
[ 68.5% - 69.0% ] 68.84% | 796 | 14.4% |
[ 69.0% - 69.5% ] 69.42% | 206 | 23.8% |
[ 69.5% - 70.0% ] 69.86% | 219 | 49.0% |
[ 70.0% - 70.5% ] 70.11% | 87 | 9.2% |
[ 70.5% - 71.0% ] 70.86% | 707 | 5.8% |
[ 71.0% - 71.5% ] 71.43% | 42 | 31.0% |
[ 71.5% - 72.0% ] 71.69% | 219 | 16.9% |
[ 72.0% - 72.5% ] 72.25% | 573 | 8.2% |
[ 72.5% - 73.0% ] 72.78% | 158 | 25.9% |
[ 73.0% - 73.5% ] 73.21% | 56 | 5.4% |
[ 73.5% - 74.0% ] 73.58% | 371 | 7.0% |
[ 74.0% - 74.5% ] 74.13% | 286 | 59.8% |
[ 74.5% - 75.0% ] 74.89% | 446 | 21.7% |
[ 75.0% - 75.5% ] 75.40% | 187 | 8.0% |
[ 76.0% - 76.5% ] 76.27% | 830 | 32.3% |
[ 76.5% - 77.0% ] 76.57% | 239 | 15.5% |
[ 78.0% - 78.5% ] 78.26% | 161 | 28.0% |
[ 80.0% - 80.5% ] 80.08% | 502 | 47.0% |
[ 80.5% - 81.0% ] 80.95% | 21 | 23.8% |
[ 81.0% - 81.5% ] 81.40% | 43 | 53.5% |
[ 81.5% - 82.0% ] 81.63% | 49 | 18.4% |
[ 83.0% - 83.5% ] 83.16% | 95 | 4.2% |
[ 84.0% - 84.5% ] 84.07% | 226 | 6.6% |
[ 85.0% - 85.5% ] 85.11% | 47 | 14.9% |
[ 91.0% - 91.5% ] 91.15% | 226 | 63.7% |
[ 93.0% - 93.5% ] 93.48% | 138 | 42.0% |
[ 94.5% - 95.0% ] 94.51% | 510 | 22.7% |
[ 99.5% - 100.0% ] 100.00% | 752 | 63.4% |