Irish Disability Age 5 to 17
COMPARE
Irish
Select to Compare
Disability Age 5 to 17
Irish Disability Age 5 to 17
6.2%
DISABILITY | AGE 5 TO 17
0.0/ 100
METRIC RATING
294th/ 347
METRIC RANK
Irish Disability Age 5 to 17 Correlation Chart
The statistical analysis conducted on geographies consisting of 563,958,915 people shows a substantial positive correlation between the proportion of Irish and percentage of population with a disability between the ages 5 and 17 in the United States with a correlation coefficient (R) of 0.594 and weighted average of 6.2%. On average, for every 1% (one percent) increase in Irish within a typical geography, there is an increase of 0.43% in percentage of population with a disability between the ages 5 and 17.
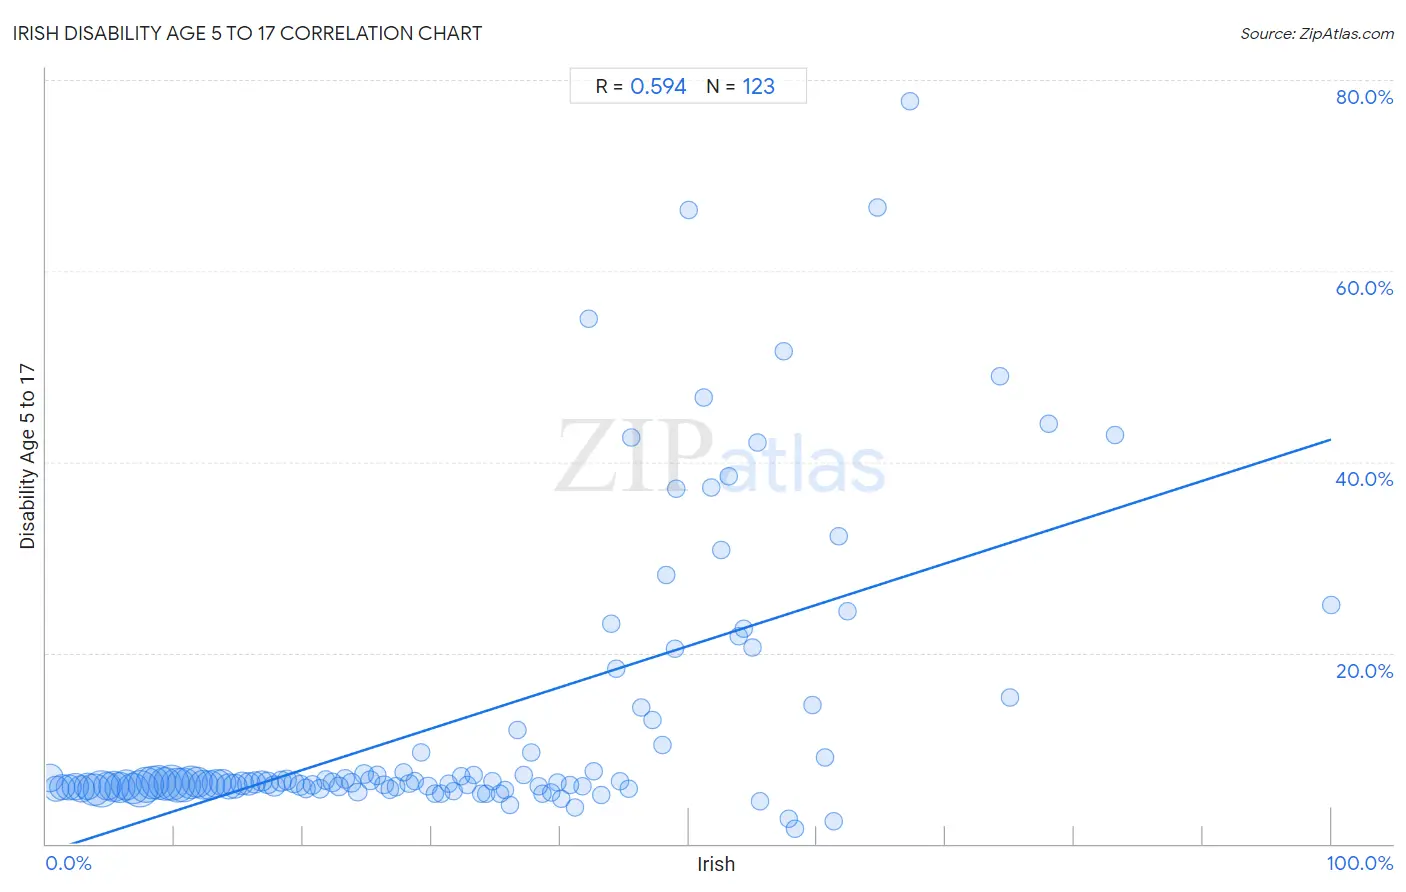
It is essential to understand that the correlation between the percentage of Irish and percentage of population with a disability between the ages 5 and 17 does not imply a direct cause-and-effect relationship. It remains uncertain whether the presence of Irish influences an upward or downward trend in the level of percentage of population with a disability between the ages 5 and 17 within an area, or if Irish simply ended up residing in those areas with higher or lower levels of percentage of population with a disability between the ages 5 and 17 due to other factors.
Demographics Similar to Irish by Disability Age 5 to 17
In terms of disability age 5 to 17, the demographic groups most similar to Irish are Central American Indian (6.2%, a difference of 0.0%), Immigrants from Senegal (6.2%, a difference of 0.020%), White/Caucasian (6.2%, a difference of 0.26%), Cree (6.2%, a difference of 0.27%), and Spanish American (6.2%, a difference of 0.30%).
| Demographics | Rating | Rank | Disability Age 5 to 17 |
| Pima | 0.0 /100 | #287 | Tragic 6.2% |
| Jamaicans | 0.0 /100 | #288 | Tragic 6.2% |
| Yaqui | 0.0 /100 | #289 | Tragic 6.2% |
| Immigrants from Congo | 0.0 /100 | #290 | Tragic 6.2% |
| Whites/Caucasians | 0.0 /100 | #291 | Tragic 6.2% |
| Immigrants from Senegal | 0.0 /100 | #292 | Tragic 6.2% |
| Central American Indians | 0.0 /100 | #293 | Tragic 6.2% |
| Irish | 0.0 /100 | #294 | Tragic 6.2% |
| Cree | 0.0 /100 | #295 | Tragic 6.2% |
| Spanish Americans | 0.0 /100 | #296 | Tragic 6.2% |
| Immigrants from Bahamas | 0.0 /100 | #297 | Tragic 6.2% |
| Lumbee | 0.0 /100 | #298 | Tragic 6.2% |
| Welsh | 0.0 /100 | #299 | Tragic 6.3% |
| Carpatho Rusyns | 0.0 /100 | #300 | Tragic 6.3% |
| U.S. Virgin Islanders | 0.0 /100 | #301 | Tragic 6.3% |
Irish Disability Age 5 to 17 Correlation Summary
| Measurement | Irish Data | Disability Age 5 to 17 Data |
| Minimum | 0.26% | 1.5% |
| Maximum | 100.0% | 77.8% |
| Range | 99.7% | 76.2% |
| Mean | 32.2% | 13.0% |
| Median | 30.7% | 6.4% |
| Interquartile 25% (IQ1) | 15.2% | 5.9% |
| Interquartile 75% (IQ3) | 46.3% | 10.3% |
| Interquartile Range (IQR) | 31.0% | 4.4% |
| Standard Deviation (Sample) | 20.5% | 14.9% |
| Standard Deviation (Population) | 20.4% | 14.9% |
Correlation Details
| Irish Percentile | Sample Size | Disability Age 5 to 17 |
[ 0.0% - 0.5% ] 0.26% | 12,409,705 | 6.9% |
[ 0.5% - 1.0% ] 0.73% | 10,242,956 | 5.7% |
[ 1.0% - 1.5% ] 1.26% | 10,981,282 | 5.9% |
[ 1.5% - 2.0% ] 1.76% | 10,399,953 | 5.9% |
[ 2.0% - 2.5% ] 2.26% | 10,842,984 | 6.0% |
[ 2.5% - 3.0% ] 2.74% | 11,717,186 | 5.7% |
[ 3.0% - 3.5% ] 3.25% | 11,675,650 | 6.0% |
[ 3.5% - 4.0% ] 3.71% | 19,558,996 | 5.6% |
[ 4.0% - 4.5% ] 4.30% | 25,116,014 | 5.7% |
[ 4.5% - 5.0% ] 4.74% | 13,994,580 | 6.1% |
[ 5.0% - 5.5% ] 5.24% | 16,540,859 | 6.0% |
[ 5.5% - 6.0% ] 5.74% | 17,041,342 | 5.9% |
[ 6.0% - 6.5% ] 6.25% | 17,143,709 | 6.2% |
[ 6.5% - 7.0% ] 6.76% | 17,602,607 | 5.8% |
[ 7.0% - 7.5% ] 7.25% | 25,428,270 | 5.8% |
[ 7.5% - 8.0% ] 7.75% | 24,171,688 | 6.1% |
[ 8.0% - 8.5% ] 8.26% | 20,200,697 | 6.4% |
[ 8.5% - 9.0% ] 8.73% | 22,153,993 | 6.4% |
[ 9.0% - 9.5% ] 9.25% | 20,070,715 | 6.2% |
[ 9.5% - 10.0% ] 9.75% | 23,237,697 | 6.4% |
[ 10.0% - 10.5% ] 10.24% | 21,562,825 | 6.2% |
[ 10.5% - 11.0% ] 10.74% | 22,208,765 | 6.2% |
[ 11.0% - 11.5% ] 11.26% | 20,784,753 | 6.4% |
[ 11.5% - 12.0% ] 11.76% | 17,612,151 | 6.5% |
[ 12.0% - 12.5% ] 12.22% | 15,966,469 | 6.2% |
[ 12.5% - 13.0% ] 12.76% | 14,861,237 | 6.2% |
[ 13.0% - 13.5% ] 13.24% | 14,341,137 | 6.3% |
[ 13.5% - 14.0% ] 13.74% | 11,332,052 | 6.4% |
[ 14.0% - 14.5% ] 14.24% | 9,802,397 | 6.1% |
[ 14.5% - 15.0% ] 14.73% | 8,463,091 | 6.0% |
[ 15.0% - 15.5% ] 15.24% | 7,799,257 | 6.3% |
[ 15.5% - 16.0% ] 15.75% | 6,445,434 | 6.3% |
[ 16.0% - 16.5% ] 16.25% | 5,252,966 | 6.4% |
[ 16.5% - 17.0% ] 16.74% | 4,119,599 | 6.6% |
[ 17.0% - 17.5% ] 17.25% | 4,219,935 | 6.4% |
[ 17.5% - 18.0% ] 17.74% | 3,730,124 | 6.0% |
[ 18.0% - 18.5% ] 18.25% | 3,478,257 | 6.5% |
[ 18.5% - 19.0% ] 18.74% | 3,193,088 | 6.7% |
[ 19.0% - 19.5% ] 19.27% | 2,846,055 | 6.4% |
[ 19.5% - 20.0% ] 19.76% | 2,658,047 | 6.1% |
[ 20.0% - 20.5% ] 20.22% | 2,515,403 | 5.8% |
[ 20.5% - 21.0% ] 20.75% | 1,901,729 | 6.1% |
[ 21.0% - 21.5% ] 21.26% | 1,700,609 | 5.8% |
[ 21.5% - 22.0% ] 21.74% | 1,604,681 | 6.7% |
[ 22.0% - 22.5% ] 22.27% | 1,906,380 | 6.4% |
[ 22.5% - 23.0% ] 22.75% | 1,359,590 | 6.0% |
[ 23.0% - 23.5% ] 23.27% | 1,294,121 | 6.8% |
[ 23.5% - 24.0% ] 23.77% | 970,756 | 6.4% |
[ 24.0% - 24.5% ] 24.26% | 1,091,141 | 5.4% |
[ 24.5% - 25.0% ] 24.73% | 799,860 | 7.3% |
[ 25.0% - 25.5% ] 25.24% | 936,824 | 6.6% |
[ 25.5% - 26.0% ] 25.75% | 693,852 | 7.2% |
[ 26.0% - 26.5% ] 26.31% | 610,967 | 6.2% |
[ 26.5% - 27.0% ] 26.76% | 450,388 | 5.7% |
[ 27.0% - 27.5% ] 27.21% | 460,487 | 6.0% |
[ 27.5% - 28.0% ] 27.81% | 447,305 | 7.5% |
[ 28.0% - 28.5% ] 28.24% | 540,858 | 6.3% |
[ 28.5% - 29.0% ] 28.72% | 435,816 | 6.5% |
[ 29.0% - 29.5% ] 29.21% | 316,214 | 9.6% |
[ 29.5% - 30.0% ] 29.70% | 424,456 | 6.0% |
[ 30.0% - 30.5% ] 30.25% | 256,777 | 5.3% |
[ 30.5% - 31.0% ] 30.71% | 240,826 | 5.2% |
[ 31.0% - 31.5% ] 31.33% | 214,373 | 6.3% |
[ 31.5% - 32.0% ] 31.74% | 326,537 | 5.5% |
[ 32.0% - 32.5% ] 32.27% | 162,254 | 7.0% |
[ 32.5% - 33.0% ] 32.80% | 112,368 | 6.2% |
[ 33.0% - 33.5% ] 33.25% | 74,908 | 7.2% |
[ 33.5% - 34.0% ] 33.81% | 137,156 | 5.2% |
[ 34.0% - 34.5% ] 34.22% | 59,669 | 5.2% |
[ 34.5% - 35.0% ] 34.76% | 134,861 | 6.6% |
[ 35.0% - 35.5% ] 35.29% | 97,539 | 5.3% |
[ 35.5% - 36.0% ] 35.69% | 34,276 | 5.7% |
[ 36.0% - 36.5% ] 36.10% | 66,406 | 4.1% |
[ 36.5% - 37.0% ] 36.67% | 28,366 | 12.0% |
[ 37.0% - 37.5% ] 37.14% | 38,343 | 7.2% |
[ 37.5% - 38.0% ] 37.77% | 25,867 | 9.5% |
[ 38.0% - 38.5% ] 38.33% | 30,384 | 6.0% |
[ 38.5% - 39.0% ] 38.64% | 32,470 | 5.2% |
[ 39.0% - 39.5% ] 39.30% | 68,447 | 5.4% |
[ 39.5% - 40.0% ] 39.76% | 29,806 | 6.4% |
[ 40.0% - 40.5% ] 40.06% | 22,529 | 4.7% |
[ 40.5% - 41.0% ] 40.80% | 3,647 | 6.1% |
[ 41.0% - 41.5% ] 41.15% | 11,675 | 3.9% |
[ 41.5% - 42.0% ] 41.73% | 29,945 | 6.1% |
[ 42.0% - 42.5% ] 42.17% | 1,373 | 55.0% |
[ 42.5% - 43.0% ] 42.63% | 8,652 | 7.5% |
[ 43.0% - 43.5% ] 43.20% | 6,033 | 5.1% |
[ 43.5% - 44.0% ] 43.95% | 769 | 23.0% |
[ 44.0% - 44.5% ] 44.39% | 3,672 | 18.3% |
[ 44.5% - 45.0% ] 44.65% | 2,347 | 6.6% |
[ 45.0% - 45.5% ] 45.36% | 2,405 | 5.8% |
[ 45.5% - 46.0% ] 45.54% | 718 | 42.5% |
[ 46.0% - 46.5% ] 46.27% | 2,131 | 14.3% |
[ 47.0% - 47.5% ] 47.14% | 3,044 | 12.9% |
[ 47.5% - 48.0% ] 47.93% | 4,196 | 10.3% |
[ 48.0% - 48.5% ] 48.26% | 605 | 28.1% |
[ 48.5% - 49.0% ] 48.89% | 585 | 20.4% |
[ 49.0% - 49.5% ] 49.01% | 406 | 37.2% |
[ 50.0% - 50.5% ] 50.00% | 182 | 66.3% |
[ 51.0% - 51.5% ] 51.18% | 936 | 46.8% |
[ 51.5% - 52.0% ] 51.77% | 819 | 37.4% |
[ 52.5% - 53.0% ] 52.53% | 257 | 30.8% |
[ 53.0% - 53.5% ] 53.12% | 32 | 38.5% |
[ 53.5% - 54.0% ] 53.88% | 3,946 | 21.8% |
[ 54.0% - 54.5% ] 54.30% | 593 | 22.5% |
[ 54.5% - 55.0% ] 54.98% | 311 | 20.5% |
[ 55.0% - 55.5% ] 55.36% | 1,409 | 42.0% |
[ 55.5% - 56.0% ] 55.58% | 520 | 4.4% |
[ 57.0% - 57.5% ] 57.35% | 211 | 51.6% |
[ 57.5% - 58.0% ] 57.79% | 443 | 2.7% |
[ 58.0% - 58.5% ] 58.27% | 369 | 1.5% |
[ 59.5% - 60.0% ] 59.60% | 250 | 14.6% |
[ 60.5% - 61.0% ] 60.63% | 127 | 9.1% |
[ 61.0% - 61.5% ] 61.27% | 426 | 2.3% |
[ 61.5% - 62.0% ] 61.67% | 514 | 32.2% |
[ 62.0% - 62.5% ] 62.37% | 558 | 24.3% |
[ 64.5% - 65.0% ] 64.71% | 119 | 66.7% |
[ 67.0% - 67.5% ] 67.17% | 198 | 77.8% |
[ 74.0% - 74.5% ] 74.26% | 101 | 49.0% |
[ 75.0% - 75.5% ] 75.00% | 64 | 15.4% |
[ 78.0% - 78.5% ] 78.05% | 82 | 44.0% |
[ 83.0% - 83.5% ] 83.16% | 95 | 42.9% |
[ 99.5% - 100.0% ] 100.00% | 29 | 25.0% |