Irish Married-couple Households
COMPARE
Irish
Select to Compare
Married-couple Households
Irish Married-couple Households
48.6%
MARRIED-COUPLE HOUSEHOLDS
99.3/ 100
METRIC RATING
52nd/ 347
METRIC RANK
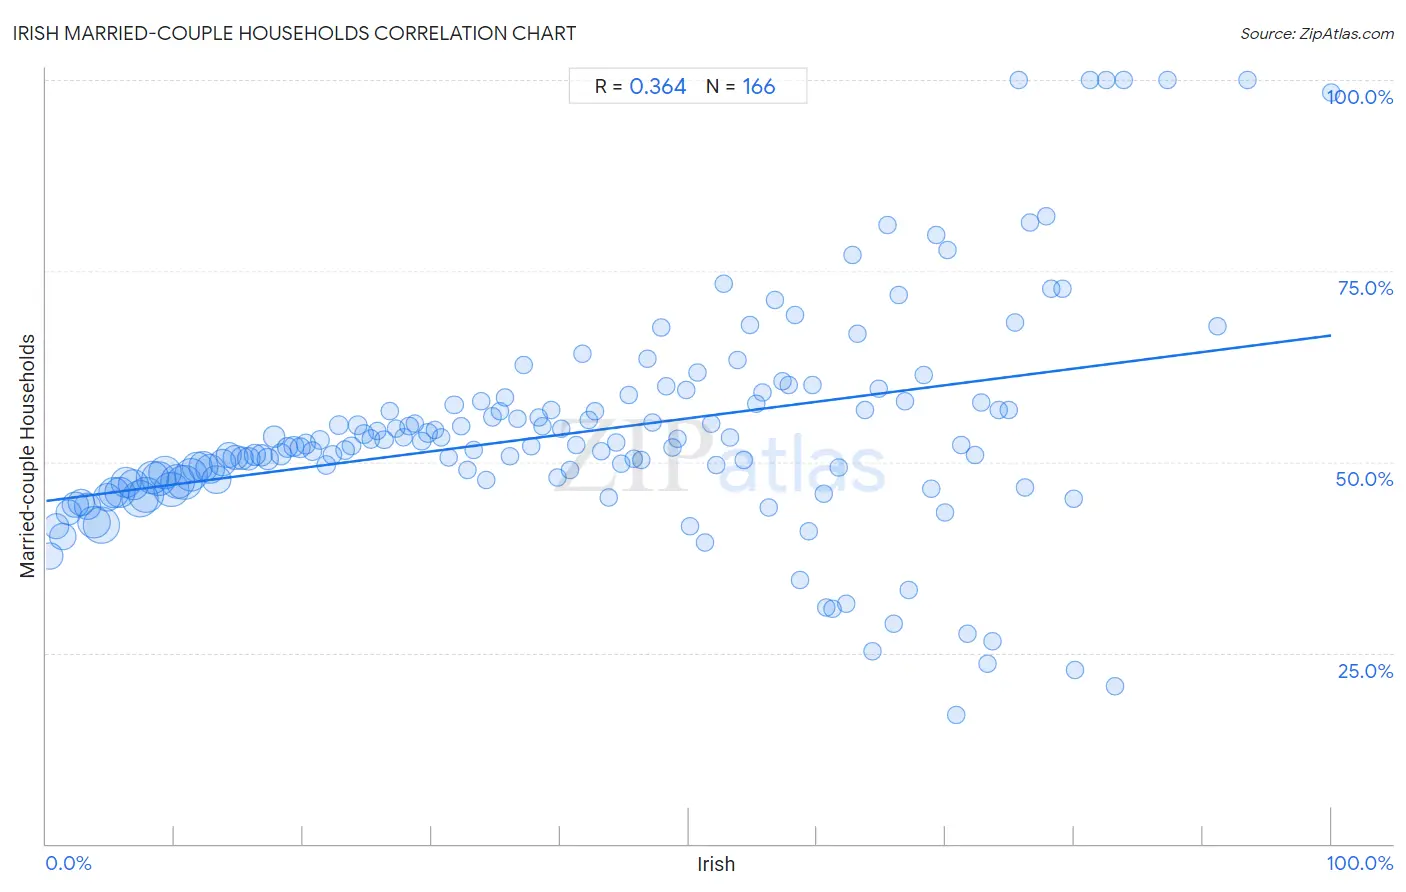
Irish Married-couple Households Correlation Chart
The statistical analysis conducted on geographies consisting of 579,966,528 people shows a mild positive correlation between the proportion of Irish and percentage of married-couple family households in the United States with a correlation coefficient (R) of 0.364 and weighted average of 48.6%. On average, for every 1% (one percent) increase in Irish within a typical geography, there is an increase of 0.22% in percentage of married-couple family households.
It is essential to understand that the correlation between the percentage of Irish and percentage of married-couple family households does not imply a direct cause-and-effect relationship. It remains uncertain whether the presence of Irish influences an upward or downward trend in the level of percentage of married-couple family households within an area, or if Irish simply ended up residing in those areas with higher or lower levels of percentage of married-couple family households due to other factors.
Demographics Similar to Irish by Married-couple Households
In terms of married-couple households, the demographic groups most similar to Irish are Eastern European (48.6%, a difference of 0.040%), White/Caucasian (48.6%, a difference of 0.050%), Immigrants from Lithuania (48.6%, a difference of 0.060%), Austrian (48.6%, a difference of 0.060%), and Immigrants from Northern Europe (48.6%, a difference of 0.070%).
| Demographics | Rating | Rank | Married-couple Households |
| Immigrants from Eastern Asia | 99.5 /100 | #45 | Exceptional 48.8% |
| Tsimshian | 99.5 /100 | #46 | Exceptional 48.7% |
| British | 99.5 /100 | #47 | Exceptional 48.7% |
| Indians (Asian) | 99.4 /100 | #48 | Exceptional 48.7% |
| Immigrants from Sri Lanka | 99.4 /100 | #49 | Exceptional 48.7% |
| Samoans | 99.4 /100 | #50 | Exceptional 48.7% |
| Eastern Europeans | 99.3 /100 | #51 | Exceptional 48.6% |
| Irish | 99.3 /100 | #52 | Exceptional 48.6% |
| Whites/Caucasians | 99.3 /100 | #53 | Exceptional 48.6% |
| Immigrants from Lithuania | 99.3 /100 | #54 | Exceptional 48.6% |
| Austrians | 99.3 /100 | #55 | Exceptional 48.6% |
| Immigrants from Northern Europe | 99.3 /100 | #56 | Exceptional 48.6% |
| Poles | 99.2 /100 | #57 | Exceptional 48.5% |
| Immigrants from Indonesia | 99.2 /100 | #58 | Exceptional 48.5% |
| Czechoslovakians | 99.2 /100 | #59 | Exceptional 48.5% |
Irish Married-couple Households Correlation Summary
| Measurement | Irish Data | Married-couple Households Data |
| Minimum | 0.26% | 16.8% |
| Maximum | 100.0% | 100.0% |
| Range | 99.7% | 83.2% |
| Mean | 41.9% | 54.0% |
| Median | 41.5% | 52.1% |
| Interquartile 25% (IQ1) | 20.7% | 47.4% |
| Interquartile 75% (IQ3) | 62.3% | 57.8% |
| Interquartile Range (IQR) | 41.5% | 10.4% |
| Standard Deviation (Sample) | 24.8% | 14.7% |
| Standard Deviation (Population) | 24.7% | 14.7% |
Correlation Details
| Irish Percentile | Sample Size | Married-couple Households |
[ 0.0% - 0.5% ] 0.26% | 12,557,785 | 37.7% |
[ 0.5% - 1.0% ] 0.73% | 10,448,361 | 41.6% |
[ 1.0% - 1.5% ] 1.26% | 11,263,420 | 40.3% |
[ 1.5% - 2.0% ] 1.76% | 10,688,536 | 43.4% |
[ 2.0% - 2.5% ] 2.26% | 11,136,982 | 44.4% |
[ 2.5% - 3.0% ] 2.74% | 12,043,938 | 44.7% |
[ 3.0% - 3.5% ] 3.25% | 11,954,400 | 44.2% |
[ 3.5% - 4.0% ] 3.71% | 19,911,041 | 42.1% |
[ 4.0% - 4.5% ] 4.30% | 25,455,751 | 41.7% |
[ 4.5% - 5.0% ] 4.74% | 14,366,397 | 45.4% |
[ 5.0% - 5.5% ] 5.24% | 16,858,464 | 46.0% |
[ 5.5% - 6.0% ] 5.74% | 17,470,026 | 45.9% |
[ 6.0% - 6.5% ] 6.25% | 17,530,218 | 47.3% |
[ 6.5% - 7.0% ] 6.76% | 17,986,346 | 47.0% |
[ 7.0% - 7.5% ] 7.25% | 25,832,106 | 45.1% |
[ 7.5% - 8.0% ] 7.75% | 24,513,064 | 45.7% |
[ 8.0% - 8.5% ] 8.26% | 20,652,650 | 47.9% |
[ 8.5% - 9.0% ] 8.73% | 22,674,011 | 47.8% |
[ 9.0% - 9.5% ] 9.25% | 20,596,359 | 48.6% |
[ 9.5% - 10.0% ] 9.75% | 23,738,229 | 46.4% |
[ 10.0% - 10.5% ] 10.24% | 21,951,414 | 47.4% |
[ 10.5% - 11.0% ] 10.74% | 22,708,120 | 47.4% |
[ 11.0% - 11.5% ] 11.26% | 21,161,893 | 48.3% |
[ 11.5% - 12.0% ] 11.76% | 17,997,878 | 49.3% |
[ 12.0% - 12.5% ] 12.23% | 16,426,205 | 49.4% |
[ 12.5% - 13.0% ] 12.76% | 15,250,937 | 49.1% |
[ 13.0% - 13.5% ] 13.24% | 14,800,588 | 47.7% |
[ 13.5% - 14.0% ] 13.74% | 11,722,032 | 49.9% |
[ 14.0% - 14.5% ] 14.24% | 10,198,755 | 50.9% |
[ 14.5% - 15.0% ] 14.74% | 8,853,475 | 50.6% |
[ 15.0% - 15.5% ] 15.24% | 8,230,070 | 50.5% |
[ 15.5% - 16.0% ] 15.75% | 6,699,537 | 50.3% |
[ 16.0% - 16.5% ] 16.25% | 5,539,468 | 50.9% |
[ 16.5% - 17.0% ] 16.74% | 4,407,552 | 50.9% |
[ 17.0% - 17.5% ] 17.25% | 4,431,963 | 50.3% |
[ 17.5% - 18.0% ] 17.74% | 4,019,015 | 53.3% |
[ 18.0% - 18.5% ] 18.25% | 3,705,072 | 51.0% |
[ 18.5% - 19.0% ] 18.74% | 3,387,144 | 51.9% |
[ 19.0% - 19.5% ] 19.27% | 3,040,400 | 52.1% |
[ 19.5% - 20.0% ] 19.76% | 2,855,767 | 51.8% |
[ 20.0% - 20.5% ] 20.22% | 2,675,795 | 52.3% |
[ 20.5% - 21.0% ] 20.74% | 2,037,363 | 51.4% |
[ 21.0% - 21.5% ] 21.26% | 1,852,228 | 52.9% |
[ 21.5% - 22.0% ] 21.74% | 1,727,830 | 49.5% |
[ 22.0% - 22.5% ] 22.27% | 2,032,404 | 50.9% |
[ 22.5% - 23.0% ] 22.75% | 1,457,332 | 54.9% |
[ 23.0% - 23.5% ] 23.27% | 1,404,713 | 51.5% |
[ 23.5% - 24.0% ] 23.76% | 1,052,839 | 52.1% |
[ 24.0% - 24.5% ] 24.26% | 1,163,903 | 54.8% |
[ 24.5% - 25.0% ] 24.73% | 876,843 | 53.7% |
[ 25.0% - 25.5% ] 25.24% | 1,029,189 | 53.0% |
[ 25.5% - 26.0% ] 25.76% | 759,889 | 54.1% |
[ 26.0% - 26.5% ] 26.29% | 706,122 | 52.9% |
[ 26.5% - 27.0% ] 26.76% | 502,866 | 56.7% |
[ 27.0% - 27.5% ] 27.22% | 497,596 | 54.3% |
[ 27.5% - 28.0% ] 27.80% | 487,101 | 53.2% |
[ 28.0% - 28.5% ] 28.24% | 579,215 | 54.7% |
[ 28.5% - 29.0% ] 28.72% | 482,710 | 55.0% |
[ 29.0% - 29.5% ] 29.22% | 354,456 | 52.7% |
[ 29.5% - 30.0% ] 29.70% | 465,113 | 53.8% |
[ 30.0% - 30.5% ] 30.24% | 282,953 | 54.2% |
[ 30.5% - 31.0% ] 30.72% | 271,284 | 53.2% |
[ 31.0% - 31.5% ] 31.32% | 242,160 | 50.5% |
[ 31.5% - 32.0% ] 31.74% | 354,302 | 57.5% |
[ 32.0% - 32.5% ] 32.27% | 185,661 | 54.6% |
[ 32.5% - 33.0% ] 32.80% | 128,549 | 48.9% |
[ 33.0% - 33.5% ] 33.25% | 95,901 | 51.6% |
[ 33.5% - 34.0% ] 33.81% | 152,741 | 57.9% |
[ 34.0% - 34.5% ] 34.23% | 78,145 | 47.6% |
[ 34.5% - 35.0% ] 34.76% | 146,504 | 55.9% |
[ 35.0% - 35.5% ] 35.29% | 103,716 | 56.6% |
[ 35.5% - 36.0% ] 35.70% | 40,355 | 58.5% |
[ 36.0% - 36.5% ] 36.12% | 83,521 | 50.8% |
[ 36.5% - 37.0% ] 36.70% | 41,885 | 55.6% |
[ 37.0% - 37.5% ] 37.15% | 46,923 | 62.6% |
[ 37.5% - 38.0% ] 37.77% | 31,606 | 52.1% |
[ 38.0% - 38.5% ] 38.28% | 41,731 | 55.9% |
[ 38.5% - 39.0% ] 38.65% | 35,575 | 54.7% |
[ 39.0% - 39.5% ] 39.30% | 76,172 | 56.8% |
[ 39.5% - 40.0% ] 39.77% | 40,819 | 48.0% |
[ 40.0% - 40.5% ] 40.11% | 29,779 | 54.3% |
[ 40.5% - 41.0% ] 40.74% | 12,976 | 48.9% |
[ 41.0% - 41.5% ] 41.26% | 19,759 | 52.3% |
[ 41.5% - 42.0% ] 41.74% | 34,816 | 64.2% |
[ 42.0% - 42.5% ] 42.22% | 4,600 | 55.4% |
[ 42.5% - 43.0% ] 42.67% | 11,561 | 56.6% |
[ 43.0% - 43.5% ] 43.23% | 10,400 | 51.3% |
[ 43.5% - 44.0% ] 43.80% | 3,427 | 45.3% |
[ 44.0% - 44.5% ] 44.35% | 8,275 | 52.6% |
[ 44.5% - 45.0% ] 44.73% | 7,122 | 49.7% |
[ 45.0% - 45.5% ] 45.31% | 21,157 | 58.7% |
[ 45.5% - 46.0% ] 45.71% | 3,540 | 50.3% |
[ 46.0% - 46.5% ] 46.26% | 3,621 | 50.3% |
[ 46.5% - 47.0% ] 46.79% | 2,090 | 63.5% |
[ 47.0% - 47.5% ] 47.19% | 17,145 | 55.1% |
[ 47.5% - 48.0% ] 47.87% | 7,742 | 67.6% |
[ 48.0% - 48.5% ] 48.27% | 3,737 | 59.9% |
[ 48.5% - 49.0% ] 48.75% | 1,477 | 51.9% |
[ 49.0% - 49.5% ] 49.13% | 2,009 | 53.0% |
[ 49.5% - 50.0% ] 49.84% | 3,796 | 59.4% |
[ 50.0% - 50.5% ] 50.14% | 2,934 | 41.6% |
[ 50.5% - 51.0% ] 50.70% | 3,420 | 61.6% |
[ 51.0% - 51.5% ] 51.22% | 2,255 | 39.4% |
[ 51.5% - 52.0% ] 51.77% | 1,833 | 55.0% |
[ 52.0% - 52.5% ] 52.19% | 1,533 | 49.5% |
[ 52.5% - 53.0% ] 52.72% | 4,067 | 73.4% |
[ 53.0% - 53.5% ] 53.24% | 4,341 | 53.2% |
[ 53.5% - 54.0% ] 53.84% | 5,667 | 63.4% |
[ 54.0% - 54.5% ] 54.24% | 1,674 | 50.3% |
[ 54.5% - 55.0% ] 54.80% | 1,949 | 67.9% |
[ 55.0% - 55.5% ] 55.28% | 3,137 | 57.5% |
[ 55.5% - 56.0% ] 55.70% | 1,894 | 59.0% |
[ 56.0% - 56.5% ] 56.23% | 1,677 | 43.9% |
[ 56.5% - 57.0% ] 56.72% | 737 | 71.2% |
[ 57.0% - 57.5% ] 57.26% | 627 | 60.6% |
[ 57.5% - 58.0% ] 57.77% | 1,596 | 60.1% |
[ 58.0% - 58.5% ] 58.24% | 807 | 69.3% |
[ 58.5% - 59.0% ] 58.62% | 145 | 34.5% |
[ 59.0% - 59.5% ] 59.30% | 882 | 40.9% |
[ 59.5% - 60.0% ] 59.63% | 1,090 | 60.1% |
[ 60.0% - 60.5% ] 60.47% | 339 | 45.8% |
[ 60.5% - 61.0% ] 60.71% | 425 | 30.9% |
[ 61.0% - 61.5% ] 61.17% | 1,705 | 30.8% |
[ 61.5% - 62.0% ] 61.67% | 1,495 | 49.3% |
[ 62.0% - 62.5% ] 62.28% | 1,177 | 31.5% |
[ 62.5% - 63.0% ] 62.73% | 1,988 | 77.1% |
[ 63.0% - 63.5% ] 63.14% | 2,108 | 66.8% |
[ 63.5% - 64.0% ] 63.73% | 863 | 56.8% |
[ 64.0% - 64.5% ] 64.31% | 311 | 25.3% |
[ 64.5% - 65.0% ] 64.77% | 1,039 | 59.6% |
[ 65.0% - 65.5% ] 65.45% | 110 | 81.0% |
[ 65.5% - 66.0% ] 65.92% | 179 | 28.8% |
[ 66.0% - 66.5% ] 66.31% | 555 | 71.9% |
[ 66.5% - 67.0% ] 66.85% | 1,104 | 58.0% |
[ 67.0% - 67.5% ] 67.13% | 435 | 33.3% |
[ 68.0% - 68.5% ] 68.24% | 614 | 61.5% |
[ 68.5% - 69.0% ] 68.86% | 1,034 | 46.6% |
[ 69.0% - 69.5% ] 69.26% | 875 | 79.7% |
[ 69.5% - 70.0% ] 69.92% | 123 | 43.4% |
[ 70.0% - 70.5% ] 70.11% | 87 | 77.8% |
[ 70.5% - 71.0% ] 70.86% | 707 | 16.8% |
[ 71.0% - 71.5% ] 71.24% | 233 | 52.3% |
[ 71.5% - 72.0% ] 71.69% | 219 | 27.5% |
[ 72.0% - 72.5% ] 72.25% | 573 | 50.9% |
[ 72.5% - 73.0% ] 72.79% | 147 | 57.8% |
[ 73.0% - 73.5% ] 73.21% | 56 | 23.5% |
[ 73.5% - 74.0% ] 73.59% | 390 | 26.5% |
[ 74.0% - 74.5% ] 74.14% | 232 | 56.8% |
[ 74.5% - 75.0% ] 74.94% | 395 | 56.7% |
[ 75.0% - 75.5% ] 75.40% | 187 | 68.3% |
[ 75.5% - 76.0% ] 75.68% | 37 | 100.0% |
[ 76.0% - 76.5% ] 76.21% | 1,160 | 46.6% |
[ 76.5% - 77.0% ] 76.57% | 239 | 81.4% |
[ 77.5% - 78.0% ] 77.78% | 72 | 82.1% |
[ 78.0% - 78.5% ] 78.17% | 142 | 72.6% |
[ 79.0% - 79.5% ] 79.12% | 182 | 72.7% |
[ 79.5% - 80.0% ] 79.94% | 324 | 45.2% |
[ 80.0% - 80.5% ] 80.08% | 502 | 22.8% |
[ 81.0% - 81.5% ] 81.25% | 80 | 100.0% |
[ 82.0% - 82.5% ] 82.50% | 120 | 100.0% |
[ 83.0% - 83.5% ] 83.16% | 95 | 20.7% |
[ 83.5% - 84.0% ] 83.87% | 31 | 100.0% |
[ 87.0% - 87.5% ] 87.22% | 133 | 100.0% |
[ 91.0% - 91.5% ] 91.15% | 226 | 67.7% |
[ 93.0% - 93.5% ] 93.48% | 138 | 100.0% |
[ 99.5% - 100.0% ] 100.00% | 669 | 98.4% |