Irish 3 or more Vehicles in Household
COMPARE
Irish
Select to Compare
3 or more Vehicles in Household
Irish 3 or more Vehicles in Household
21.8%
3+ VEHICLES AVAILABLE
99.8/ 100
METRIC RATING
77th/ 347
METRIC RANK
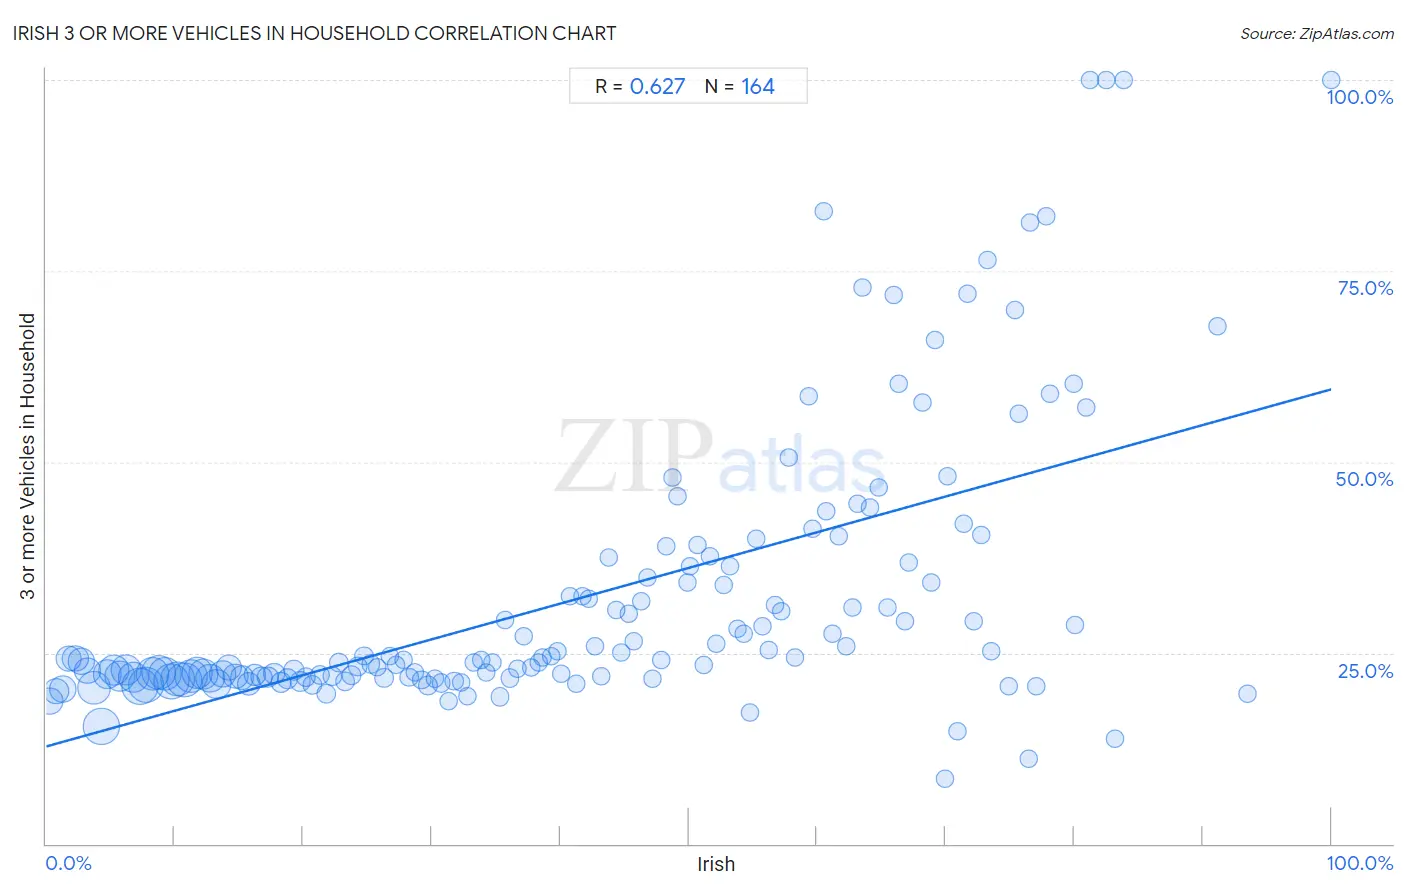
Irish 3 or more Vehicles in Household Correlation Chart
The statistical analysis conducted on geographies consisting of 579,597,686 people shows a significant positive correlation between the proportion of Irish and percentage of households with 3 or more vehicles available in the United States with a correlation coefficient (R) of 0.627 and weighted average of 21.8%. On average, for every 1% (one percent) increase in Irish within a typical geography, there is an increase of 0.47% in percentage of households with 3 or more vehicles available.
It is essential to understand that the correlation between the percentage of Irish and percentage of households with 3 or more vehicles available does not imply a direct cause-and-effect relationship. It remains uncertain whether the presence of Irish influences an upward or downward trend in the level of percentage of households with 3 or more vehicles available within an area, or if Irish simply ended up residing in those areas with higher or lower levels of percentage of households with 3 or more vehicles available due to other factors.
Demographics Similar to Irish by 3 or more Vehicles in Household
In terms of 3 or more vehicles in household, the demographic groups most similar to Irish are Nonimmigrants (21.8%, a difference of 0.070%), Japanese (21.8%, a difference of 0.12%), Czechoslovakian (21.7%, a difference of 0.13%), Assyrian/Chaldean/Syriac (21.7%, a difference of 0.13%), and Immigrants from Oceania (21.8%, a difference of 0.22%).
| Demographics | Rating | Rank | 3 or more Vehicles in Household |
| Bangladeshis | 99.8 /100 | #70 | Exceptional 21.9% |
| Potawatomi | 99.8 /100 | #71 | Exceptional 21.9% |
| Portuguese | 99.8 /100 | #72 | Exceptional 21.8% |
| Salvadorans | 99.8 /100 | #73 | Exceptional 21.8% |
| Immigrants from Oceania | 99.8 /100 | #74 | Exceptional 21.8% |
| Japanese | 99.8 /100 | #75 | Exceptional 21.8% |
| Nonimmigrants | 99.8 /100 | #76 | Exceptional 21.8% |
| Irish | 99.8 /100 | #77 | Exceptional 21.8% |
| Czechoslovakians | 99.8 /100 | #78 | Exceptional 21.7% |
| Assyrians/Chaldeans/Syriacs | 99.8 /100 | #79 | Exceptional 21.7% |
| Afghans | 99.7 /100 | #80 | Exceptional 21.7% |
| Celtics | 99.7 /100 | #81 | Exceptional 21.7% |
| Immigrants from El Salvador | 99.6 /100 | #82 | Exceptional 21.5% |
| Chippewa | 99.6 /100 | #83 | Exceptional 21.5% |
| Icelanders | 99.6 /100 | #84 | Exceptional 21.5% |
Irish 3 or more Vehicles in Household Correlation Summary
| Measurement | Irish Data | 3 or more Vehicles in Household Data |
| Minimum | 0.26% | 8.5% |
| Maximum | 100.0% | 100.0% |
| Range | 99.7% | 91.5% |
| Mean | 41.6% | 32.2% |
| Median | 41.0% | 23.9% |
| Interquartile 25% (IQ1) | 20.5% | 21.8% |
| Interquartile 75% (IQ3) | 62.0% | 35.6% |
| Interquartile Range (IQR) | 41.5% | 13.8% |
| Standard Deviation (Sample) | 24.7% | 18.4% |
| Standard Deviation (Population) | 24.6% | 18.3% |
Correlation Details
| Irish Percentile | Sample Size | 3 or more Vehicles in Household |
[ 0.0% - 0.5% ] 0.26% | 12,548,730 | 18.7% |
[ 0.5% - 1.0% ] 0.73% | 10,440,534 | 20.0% |
[ 1.0% - 1.5% ] 1.26% | 11,253,507 | 20.3% |
[ 1.5% - 2.0% ] 1.76% | 10,682,111 | 24.3% |
[ 2.0% - 2.5% ] 2.26% | 11,133,501 | 24.3% |
[ 2.5% - 3.0% ] 2.74% | 12,030,286 | 23.9% |
[ 3.0% - 3.5% ] 3.25% | 11,948,917 | 22.7% |
[ 3.5% - 4.0% ] 3.71% | 19,890,243 | 20.4% |
[ 4.0% - 4.5% ] 4.30% | 25,448,909 | 15.4% |
[ 4.5% - 5.0% ] 4.74% | 14,352,066 | 22.2% |
[ 5.0% - 5.5% ] 5.24% | 16,852,252 | 22.8% |
[ 5.5% - 6.0% ] 5.74% | 17,466,256 | 21.9% |
[ 6.0% - 6.5% ] 6.25% | 17,525,019 | 22.7% |
[ 6.5% - 7.0% ] 6.76% | 17,984,792 | 21.8% |
[ 7.0% - 7.5% ] 7.25% | 25,827,895 | 20.6% |
[ 7.5% - 8.0% ] 7.75% | 24,520,014 | 20.9% |
[ 8.0% - 8.5% ] 8.26% | 20,610,836 | 22.2% |
[ 8.5% - 9.0% ] 8.73% | 22,662,695 | 22.4% |
[ 9.0% - 9.5% ] 9.25% | 20,586,404 | 22.3% |
[ 9.5% - 10.0% ] 9.75% | 23,727,629 | 21.2% |
[ 10.0% - 10.5% ] 10.24% | 21,944,588 | 21.6% |
[ 10.5% - 11.0% ] 10.74% | 22,687,884 | 21.4% |
[ 11.0% - 11.5% ] 11.26% | 21,139,462 | 21.9% |
[ 11.5% - 12.0% ] 11.76% | 17,990,299 | 22.4% |
[ 12.0% - 12.5% ] 12.23% | 16,408,596 | 22.2% |
[ 12.5% - 13.0% ] 12.76% | 15,250,548 | 21.7% |
[ 13.0% - 13.5% ] 13.24% | 14,795,686 | 20.9% |
[ 13.5% - 14.0% ] 13.74% | 11,707,963 | 22.3% |
[ 14.0% - 14.5% ] 14.24% | 10,189,046 | 23.0% |
[ 14.5% - 15.0% ] 14.74% | 8,846,792 | 22.0% |
[ 15.0% - 15.5% ] 15.24% | 8,229,572 | 21.8% |
[ 15.5% - 16.0% ] 15.75% | 6,691,342 | 21.0% |
[ 16.0% - 16.5% ] 16.25% | 5,536,254 | 22.1% |
[ 16.5% - 17.0% ] 16.74% | 4,406,237 | 21.8% |
[ 17.0% - 17.5% ] 17.25% | 4,431,340 | 21.8% |
[ 17.5% - 18.0% ] 17.74% | 4,019,410 | 22.3% |
[ 18.0% - 18.5% ] 18.25% | 3,704,314 | 21.1% |
[ 18.5% - 19.0% ] 18.74% | 3,380,962 | 21.6% |
[ 19.0% - 19.5% ] 19.27% | 3,035,298 | 22.7% |
[ 19.5% - 20.0% ] 19.76% | 2,850,811 | 21.3% |
[ 20.0% - 20.5% ] 20.22% | 2,673,774 | 21.8% |
[ 20.5% - 21.0% ] 20.74% | 2,036,819 | 20.8% |
[ 21.0% - 21.5% ] 21.26% | 1,855,961 | 22.1% |
[ 21.5% - 22.0% ] 21.74% | 1,723,869 | 19.6% |
[ 22.0% - 22.5% ] 22.27% | 2,031,397 | 22.0% |
[ 22.5% - 23.0% ] 22.75% | 1,455,766 | 23.7% |
[ 23.0% - 23.5% ] 23.27% | 1,403,717 | 21.3% |
[ 23.5% - 24.0% ] 23.76% | 1,051,374 | 22.1% |
[ 24.0% - 24.5% ] 24.26% | 1,163,178 | 23.3% |
[ 24.5% - 25.0% ] 24.73% | 874,706 | 24.6% |
[ 25.0% - 25.5% ] 25.24% | 1,028,806 | 23.5% |
[ 25.5% - 26.0% ] 25.76% | 758,587 | 23.1% |
[ 26.0% - 26.5% ] 26.29% | 704,845 | 21.7% |
[ 26.5% - 27.0% ] 26.76% | 502,449 | 24.5% |
[ 27.0% - 27.5% ] 27.22% | 495,781 | 23.5% |
[ 27.5% - 28.0% ] 27.81% | 485,803 | 24.0% |
[ 28.0% - 28.5% ] 28.24% | 577,543 | 21.8% |
[ 28.5% - 29.0% ] 28.72% | 482,331 | 22.4% |
[ 29.0% - 29.5% ] 29.22% | 353,794 | 21.5% |
[ 29.5% - 30.0% ] 29.70% | 465,042 | 20.7% |
[ 30.0% - 30.5% ] 30.24% | 281,951 | 21.6% |
[ 30.5% - 31.0% ] 30.72% | 270,155 | 21.0% |
[ 31.0% - 31.5% ] 31.32% | 242,646 | 18.6% |
[ 31.5% - 32.0% ] 31.74% | 353,929 | 21.2% |
[ 32.0% - 32.5% ] 32.27% | 185,431 | 21.1% |
[ 32.5% - 33.0% ] 32.80% | 128,378 | 19.3% |
[ 33.0% - 33.5% ] 33.25% | 95,051 | 23.8% |
[ 33.5% - 34.0% ] 33.81% | 152,741 | 24.0% |
[ 34.0% - 34.5% ] 34.23% | 77,224 | 22.5% |
[ 34.5% - 35.0% ] 34.76% | 146,440 | 23.8% |
[ 35.0% - 35.5% ] 35.29% | 103,382 | 19.2% |
[ 35.5% - 36.0% ] 35.70% | 40,170 | 29.2% |
[ 36.0% - 36.5% ] 36.12% | 83,242 | 21.7% |
[ 36.5% - 37.0% ] 36.70% | 41,665 | 23.0% |
[ 37.0% - 37.5% ] 37.15% | 46,776 | 27.2% |
[ 37.5% - 38.0% ] 37.77% | 31,606 | 23.1% |
[ 38.0% - 38.5% ] 38.28% | 41,330 | 23.7% |
[ 38.5% - 39.0% ] 38.65% | 35,073 | 24.4% |
[ 39.0% - 39.5% ] 39.30% | 75,150 | 24.5% |
[ 39.5% - 40.0% ] 39.77% | 40,341 | 25.2% |
[ 40.0% - 40.5% ] 40.11% | 29,635 | 22.3% |
[ 40.5% - 41.0% ] 40.74% | 12,122 | 32.5% |
[ 41.0% - 41.5% ] 41.26% | 19,284 | 21.0% |
[ 41.5% - 42.0% ] 41.74% | 34,780 | 32.5% |
[ 42.0% - 42.5% ] 42.22% | 4,112 | 32.0% |
[ 42.5% - 43.0% ] 42.66% | 11,134 | 25.9% |
[ 43.0% - 43.5% ] 43.23% | 10,168 | 21.9% |
[ 43.5% - 44.0% ] 43.79% | 3,341 | 37.5% |
[ 44.0% - 44.5% ] 44.36% | 7,642 | 30.6% |
[ 44.5% - 45.0% ] 44.74% | 6,935 | 25.0% |
[ 45.0% - 45.5% ] 45.31% | 20,887 | 30.1% |
[ 45.5% - 46.0% ] 45.73% | 3,252 | 26.6% |
[ 46.0% - 46.5% ] 46.28% | 3,159 | 31.7% |
[ 46.5% - 47.0% ] 46.82% | 1,854 | 34.9% |
[ 47.0% - 47.5% ] 47.18% | 17,241 | 21.7% |
[ 47.5% - 48.0% ] 47.87% | 7,389 | 24.1% |
[ 48.0% - 48.5% ] 48.27% | 3,644 | 38.9% |
[ 48.5% - 49.0% ] 48.75% | 1,477 | 48.0% |
[ 49.0% - 49.5% ] 49.13% | 2,009 | 45.5% |
[ 49.5% - 50.0% ] 49.87% | 3,088 | 34.2% |
[ 50.0% - 50.5% ] 50.14% | 2,934 | 36.3% |
[ 50.5% - 51.0% ] 50.70% | 3,420 | 39.2% |
[ 51.0% - 51.5% ] 51.21% | 1,816 | 23.4% |
[ 51.5% - 52.0% ] 51.70% | 855 | 37.6% |
[ 52.0% - 52.5% ] 52.18% | 1,512 | 26.2% |
[ 52.5% - 53.0% ] 52.70% | 3,829 | 33.9% |
[ 53.0% - 53.5% ] 53.24% | 4,145 | 36.4% |
[ 53.5% - 54.0% ] 53.84% | 5,639 | 28.2% |
[ 54.0% - 54.5% ] 54.24% | 1,650 | 27.6% |
[ 54.5% - 55.0% ] 54.80% | 1,929 | 17.2% |
[ 55.0% - 55.5% ] 55.28% | 3,041 | 39.9% |
[ 55.5% - 56.0% ] 55.75% | 1,356 | 28.4% |
[ 56.0% - 56.5% ] 56.23% | 1,590 | 25.4% |
[ 56.5% - 57.0% ] 56.72% | 737 | 31.3% |
[ 57.0% - 57.5% ] 57.21% | 416 | 30.4% |
[ 57.5% - 58.0% ] 57.77% | 1,402 | 50.6% |
[ 58.0% - 58.5% ] 58.23% | 723 | 24.3% |
[ 59.0% - 59.5% ] 59.30% | 882 | 58.6% |
[ 59.5% - 60.0% ] 59.62% | 1,045 | 41.2% |
[ 60.0% - 60.5% ] 60.48% | 124 | 82.9% |
[ 60.5% - 61.0% ] 60.71% | 425 | 43.5% |
[ 61.0% - 61.5% ] 61.17% | 958 | 27.5% |
[ 61.5% - 62.0% ] 61.65% | 1,330 | 40.3% |
[ 62.0% - 62.5% ] 62.29% | 1,050 | 25.9% |
[ 62.5% - 63.0% ] 62.71% | 1,660 | 31.0% |
[ 63.0% - 63.5% ] 63.13% | 2,048 | 44.6% |
[ 63.5% - 64.0% ] 63.55% | 107 | 72.9% |
[ 64.0% - 64.5% ] 64.10% | 39 | 44.0% |
[ 64.5% - 65.0% ] 64.78% | 971 | 46.7% |
[ 65.0% - 65.5% ] 65.45% | 110 | 31.0% |
[ 65.5% - 66.0% ] 65.91% | 88 | 71.9% |
[ 66.0% - 66.5% ] 66.31% | 555 | 60.3% |
[ 66.5% - 67.0% ] 66.85% | 1,068 | 29.2% |
[ 67.0% - 67.5% ] 67.13% | 435 | 36.8% |
[ 68.0% - 68.5% ] 68.21% | 453 | 57.9% |
[ 68.5% - 69.0% ] 68.86% | 1,095 | 34.2% |
[ 69.0% - 69.5% ] 69.21% | 669 | 66.0% |
[ 69.5% - 70.0% ] 69.90% | 103 | 8.5% |
[ 70.0% - 70.5% ] 70.11% | 87 | 48.1% |
[ 70.5% - 71.0% ] 70.87% | 690 | 14.8% |
[ 71.0% - 71.5% ] 71.43% | 42 | 41.9% |
[ 71.5% - 72.0% ] 71.68% | 173 | 72.0% |
[ 72.0% - 72.5% ] 72.16% | 370 | 29.1% |
[ 72.5% - 73.0% ] 72.78% | 158 | 40.4% |
[ 73.0% - 73.5% ] 73.21% | 56 | 76.5% |
[ 73.5% - 74.0% ] 73.58% | 371 | 25.3% |
[ 74.5% - 75.0% ] 74.94% | 395 | 20.5% |
[ 75.0% - 75.5% ] 75.42% | 240 | 69.8% |
[ 75.5% - 76.0% ] 75.68% | 37 | 56.2% |
[ 76.0% - 76.5% ] 76.47% | 17 | 11.1% |
[ 76.5% - 77.0% ] 76.57% | 239 | 81.4% |
[ 77.0% - 77.5% ] 77.01% | 174 | 20.6% |
[ 77.5% - 78.0% ] 77.78% | 72 | 82.1% |
[ 78.0% - 78.5% ] 78.10% | 105 | 58.9% |
[ 80.0% - 80.5% ] 80.00% | 225 | 60.2% |
[ 80.0% - 80.5% ] 80.08% | 502 | 28.7% |
[ 80.5% - 81.0% ] 80.95% | 21 | 57.1% |
[ 81.0% - 81.5% ] 81.25% | 16 | 100.0% |
[ 82.0% - 82.5% ] 82.50% | 120 | 100.0% |
[ 83.0% - 83.5% ] 83.16% | 95 | 13.8% |
[ 83.5% - 84.0% ] 83.87% | 31 | 100.0% |
[ 91.0% - 91.5% ] 91.15% | 226 | 67.7% |
[ 93.0% - 93.5% ] 93.48% | 138 | 19.7% |
[ 99.5% - 100.0% ] 100.00% | 501 | 100.0% |