Irish vs Guatemalan Married-Couple Family Poverty
COMPARE
Irish
Guatemalan
Married-Couple Family Poverty
Married-Couple Family Poverty Comparison
Irish
Guatemalans
4.2%
MARRIED-COUPLE FAMILY POVERTY
99.9/ 100
METRIC RATING
33rd/ 347
METRIC RANK
7.0%
MARRIED-COUPLE FAMILY POVERTY
0.0/ 100
METRIC RATING
307th/ 347
METRIC RANK
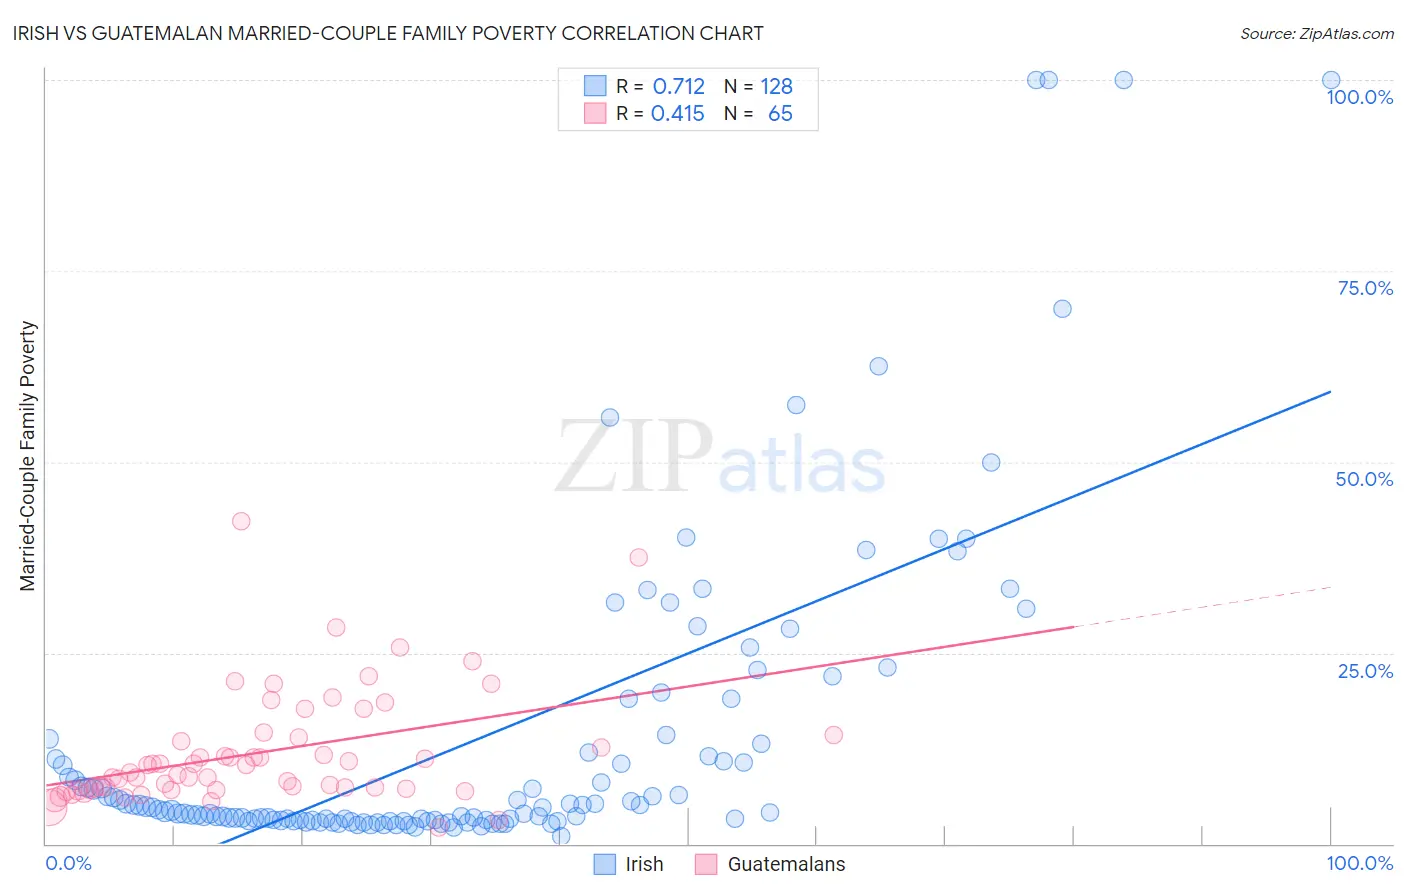
Irish vs Guatemalan Married-Couple Family Poverty Correlation Chart
The statistical analysis conducted on geographies consisting of 563,529,593 people shows a strong positive correlation between the proportion of Irish and poverty level among married-couple families in the United States with a correlation coefficient (R) of 0.712 and weighted average of 4.2%. Similarly, the statistical analysis conducted on geographies consisting of 406,520,979 people shows a moderate positive correlation between the proportion of Guatemalans and poverty level among married-couple families in the United States with a correlation coefficient (R) of 0.415 and weighted average of 7.0%, a difference of 68.0%.
Married-Couple Family Poverty Correlation Summary
| Measurement | Irish | Guatemalan |
| Minimum | 0.92% | 2.1% |
| Maximum | 100.0% | 42.2% |
| Range | 99.1% | 40.1% |
| Mean | 13.8% | 11.9% |
| Median | 4.6% | 9.3% |
| Interquartile 25% (IQ1) | 3.1% | 7.1% |
| Interquartile 75% (IQ3) | 12.5% | 14.1% |
| Interquartile Range (IQR) | 9.4% | 7.0% |
| Standard Deviation (Sample) | 20.9% | 7.5% |
| Standard Deviation (Population) | 20.8% | 7.5% |
Similar Demographics by Married-Couple Family Poverty
Demographics Similar to Irish by Married-Couple Family Poverty
In terms of married-couple family poverty, the demographic groups most similar to Irish are Dutch (4.2%, a difference of 0.23%), Greek (4.2%, a difference of 0.48%), Estonian (4.2%, a difference of 0.59%), Finnish (4.2%, a difference of 0.67%), and European (4.2%, a difference of 0.80%).
| Demographics | Rating | Rank | Married-Couple Family Poverty |
| Cypriots | 99.9 /100 | #26 | Exceptional 4.1% |
| Danes | 99.9 /100 | #27 | Exceptional 4.1% |
| Scandinavians | 99.9 /100 | #28 | Exceptional 4.1% |
| Immigrants | Scotland | 99.9 /100 | #29 | Exceptional 4.2% |
| Finns | 99.9 /100 | #30 | Exceptional 4.2% |
| Estonians | 99.9 /100 | #31 | Exceptional 4.2% |
| Greeks | 99.9 /100 | #32 | Exceptional 4.2% |
| Irish | 99.9 /100 | #33 | Exceptional 4.2% |
| Dutch | 99.9 /100 | #34 | Exceptional 4.2% |
| Europeans | 99.9 /100 | #35 | Exceptional 4.2% |
| English | 99.9 /100 | #36 | Exceptional 4.2% |
| Iranians | 99.9 /100 | #37 | Exceptional 4.2% |
| Belgians | 99.9 /100 | #38 | Exceptional 4.2% |
| Immigrants | Northern Europe | 99.8 /100 | #39 | Exceptional 4.2% |
| French Canadians | 99.8 /100 | #40 | Exceptional 4.2% |
Demographics Similar to Guatemalans by Married-Couple Family Poverty
In terms of married-couple family poverty, the demographic groups most similar to Guatemalans are Spanish American Indian (7.1%, a difference of 0.18%), Hopi (7.1%, a difference of 0.78%), Immigrants from Nicaragua (7.1%, a difference of 0.81%), Immigrants from Dominica (7.1%, a difference of 0.86%), and Immigrants from Armenia (7.1%, a difference of 0.86%).
| Demographics | Rating | Rank | Married-Couple Family Poverty |
| Immigrants | Belize | 0.0 /100 | #300 | Tragic 6.7% |
| Central Americans | 0.0 /100 | #301 | Tragic 6.7% |
| Immigrants | Ecuador | 0.0 /100 | #302 | Tragic 6.7% |
| Immigrants | El Salvador | 0.0 /100 | #303 | Tragic 6.8% |
| Cubans | 0.0 /100 | #304 | Tragic 6.8% |
| Haitians | 0.0 /100 | #305 | Tragic 6.8% |
| Immigrants | Haiti | 0.0 /100 | #306 | Tragic 7.0% |
| Guatemalans | 0.0 /100 | #307 | Tragic 7.0% |
| Spanish American Indians | 0.0 /100 | #308 | Tragic 7.1% |
| Hopi | 0.0 /100 | #309 | Tragic 7.1% |
| Immigrants | Nicaragua | 0.0 /100 | #310 | Tragic 7.1% |
| Immigrants | Dominica | 0.0 /100 | #311 | Tragic 7.1% |
| Immigrants | Armenia | 0.0 /100 | #312 | Tragic 7.1% |
| Immigrants | St. Vincent and the Grenadines | 0.0 /100 | #313 | Tragic 7.1% |
| British West Indians | 0.0 /100 | #314 | Tragic 7.1% |