Iranian vs Immigrants from Uganda Married-Couple Family Poverty
COMPARE
Iranian
Immigrants from Uganda
Married-Couple Family Poverty
Married-Couple Family Poverty Comparison
Iranians
Immigrants from Uganda
4.2%
MARRIED-COUPLE FAMILY POVERTY
99.9/ 100
METRIC RATING
37th/ 347
METRIC RANK
5.2%
MARRIED-COUPLE FAMILY POVERTY
54.9/ 100
METRIC RATING
168th/ 347
METRIC RANK
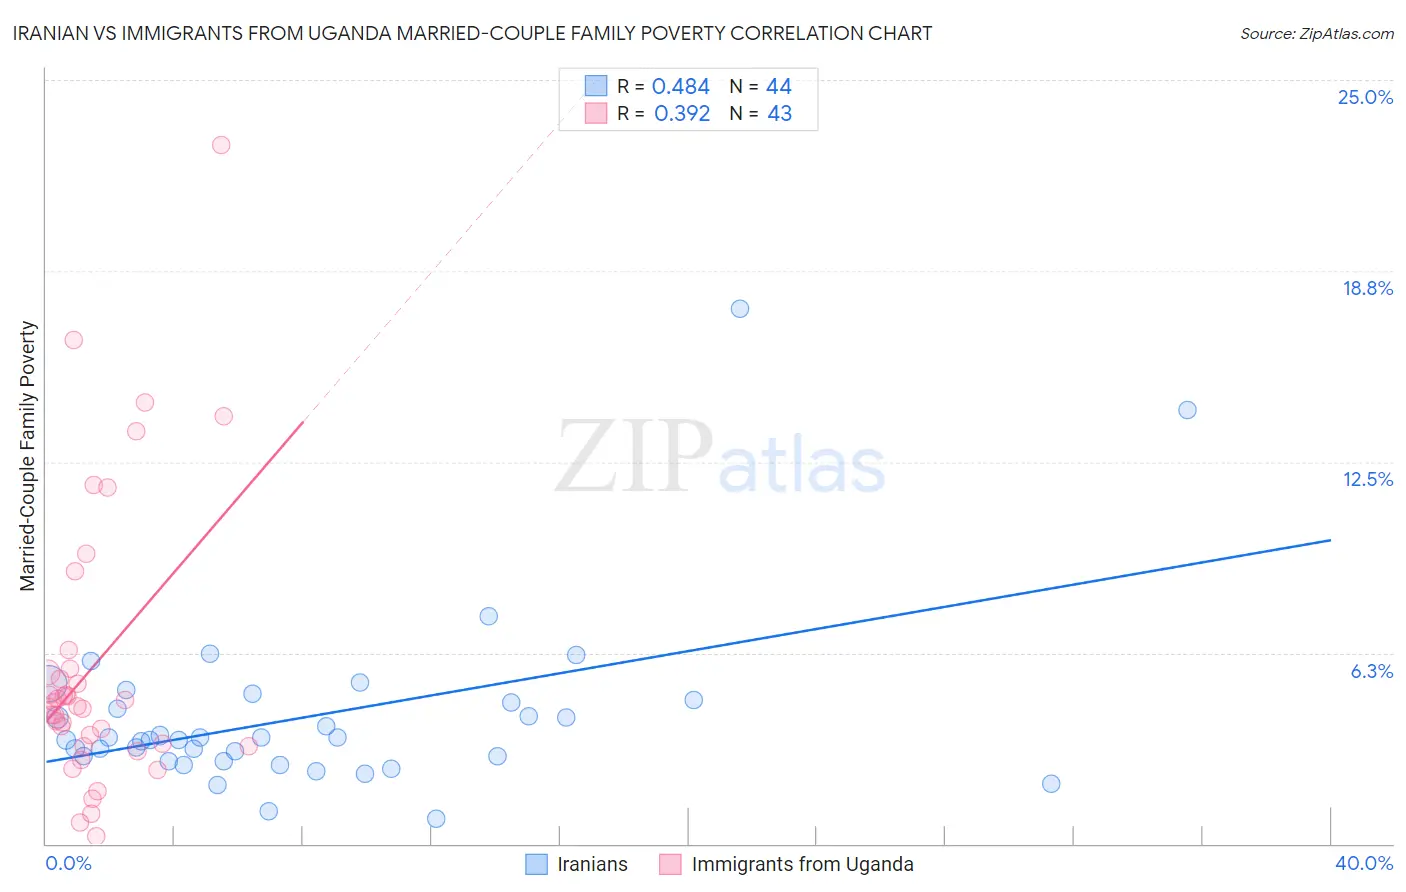
Iranian vs Immigrants from Uganda Married-Couple Family Poverty Correlation Chart
The statistical analysis conducted on geographies consisting of 314,792,069 people shows a moderate positive correlation between the proportion of Iranians and poverty level among married-couple families in the United States with a correlation coefficient (R) of 0.484 and weighted average of 4.2%. Similarly, the statistical analysis conducted on geographies consisting of 125,662,794 people shows a mild positive correlation between the proportion of Immigrants from Uganda and poverty level among married-couple families in the United States with a correlation coefficient (R) of 0.392 and weighted average of 5.2%, a difference of 22.8%.
Married-Couple Family Poverty Correlation Summary
| Measurement | Iranian | Immigrants from Uganda |
| Minimum | 0.82% | 0.25% |
| Maximum | 17.5% | 22.9% |
| Range | 16.7% | 22.6% |
| Mean | 4.2% | 5.8% |
| Median | 3.4% | 4.5% |
| Interquartile 25% (IQ1) | 2.8% | 3.2% |
| Interquartile 75% (IQ3) | 4.7% | 5.7% |
| Interquartile Range (IQR) | 1.9% | 2.5% |
| Standard Deviation (Sample) | 2.9% | 4.7% |
| Standard Deviation (Population) | 2.9% | 4.6% |
Similar Demographics by Married-Couple Family Poverty
Demographics Similar to Iranians by Married-Couple Family Poverty
In terms of married-couple family poverty, the demographic groups most similar to Iranians are English (4.2%, a difference of 0.070%), European (4.2%, a difference of 0.10%), Belgian (4.2%, a difference of 0.12%), Immigrants from Northern Europe (4.2%, a difference of 0.25%), and French Canadian (4.2%, a difference of 0.53%).
| Demographics | Rating | Rank | Married-Couple Family Poverty |
| Finns | 99.9 /100 | #30 | Exceptional 4.2% |
| Estonians | 99.9 /100 | #31 | Exceptional 4.2% |
| Greeks | 99.9 /100 | #32 | Exceptional 4.2% |
| Irish | 99.9 /100 | #33 | Exceptional 4.2% |
| Dutch | 99.9 /100 | #34 | Exceptional 4.2% |
| Europeans | 99.9 /100 | #35 | Exceptional 4.2% |
| English | 99.9 /100 | #36 | Exceptional 4.2% |
| Iranians | 99.9 /100 | #37 | Exceptional 4.2% |
| Belgians | 99.9 /100 | #38 | Exceptional 4.2% |
| Immigrants | Northern Europe | 99.8 /100 | #39 | Exceptional 4.2% |
| French Canadians | 99.8 /100 | #40 | Exceptional 4.2% |
| Northern Europeans | 99.8 /100 | #41 | Exceptional 4.3% |
| Scottish | 99.8 /100 | #42 | Exceptional 4.3% |
| Swiss | 99.8 /100 | #43 | Exceptional 4.3% |
| Immigrants | Japan | 99.8 /100 | #44 | Exceptional 4.3% |
Demographics Similar to Immigrants from Uganda by Married-Couple Family Poverty
In terms of married-couple family poverty, the demographic groups most similar to Immigrants from Uganda are Ottawa (5.2%, a difference of 0.040%), Immigrants from Argentina (5.2%, a difference of 0.060%), Bermudan (5.2%, a difference of 0.23%), Immigrants from Northern Africa (5.2%, a difference of 0.41%), and Alsatian (5.2%, a difference of 0.43%).
| Demographics | Rating | Rank | Married-Couple Family Poverty |
| Ethiopians | 68.1 /100 | #161 | Good 5.1% |
| Immigrants | Jordan | 66.5 /100 | #162 | Good 5.1% |
| Sierra Leoneans | 64.1 /100 | #163 | Good 5.1% |
| Hawaiians | 62.3 /100 | #164 | Good 5.1% |
| Immigrants | Malaysia | 62.2 /100 | #165 | Good 5.1% |
| Paraguayans | 61.5 /100 | #166 | Good 5.1% |
| Costa Ricans | 61.5 /100 | #167 | Good 5.1% |
| Immigrants | Uganda | 54.9 /100 | #168 | Average 5.2% |
| Ottawa | 54.5 /100 | #169 | Average 5.2% |
| Immigrants | Argentina | 54.4 /100 | #170 | Average 5.2% |
| Bermudans | 52.9 /100 | #171 | Average 5.2% |
| Immigrants | Northern Africa | 51.3 /100 | #172 | Average 5.2% |
| Alsatians | 51.2 /100 | #173 | Average 5.2% |
| Immigrants | Eastern Africa | 50.0 /100 | #174 | Average 5.2% |
| Marshallese | 47.9 /100 | #175 | Average 5.2% |