Iranian vs Scandinavian Married-Couple Family Poverty
COMPARE
Iranian
Scandinavian
Married-Couple Family Poverty
Married-Couple Family Poverty Comparison
Iranians
Scandinavians
4.2%
MARRIED-COUPLE FAMILY POVERTY
99.9/ 100
METRIC RATING
37th/ 347
METRIC RANK
4.1%
MARRIED-COUPLE FAMILY POVERTY
99.9/ 100
METRIC RATING
28th/ 347
METRIC RANK
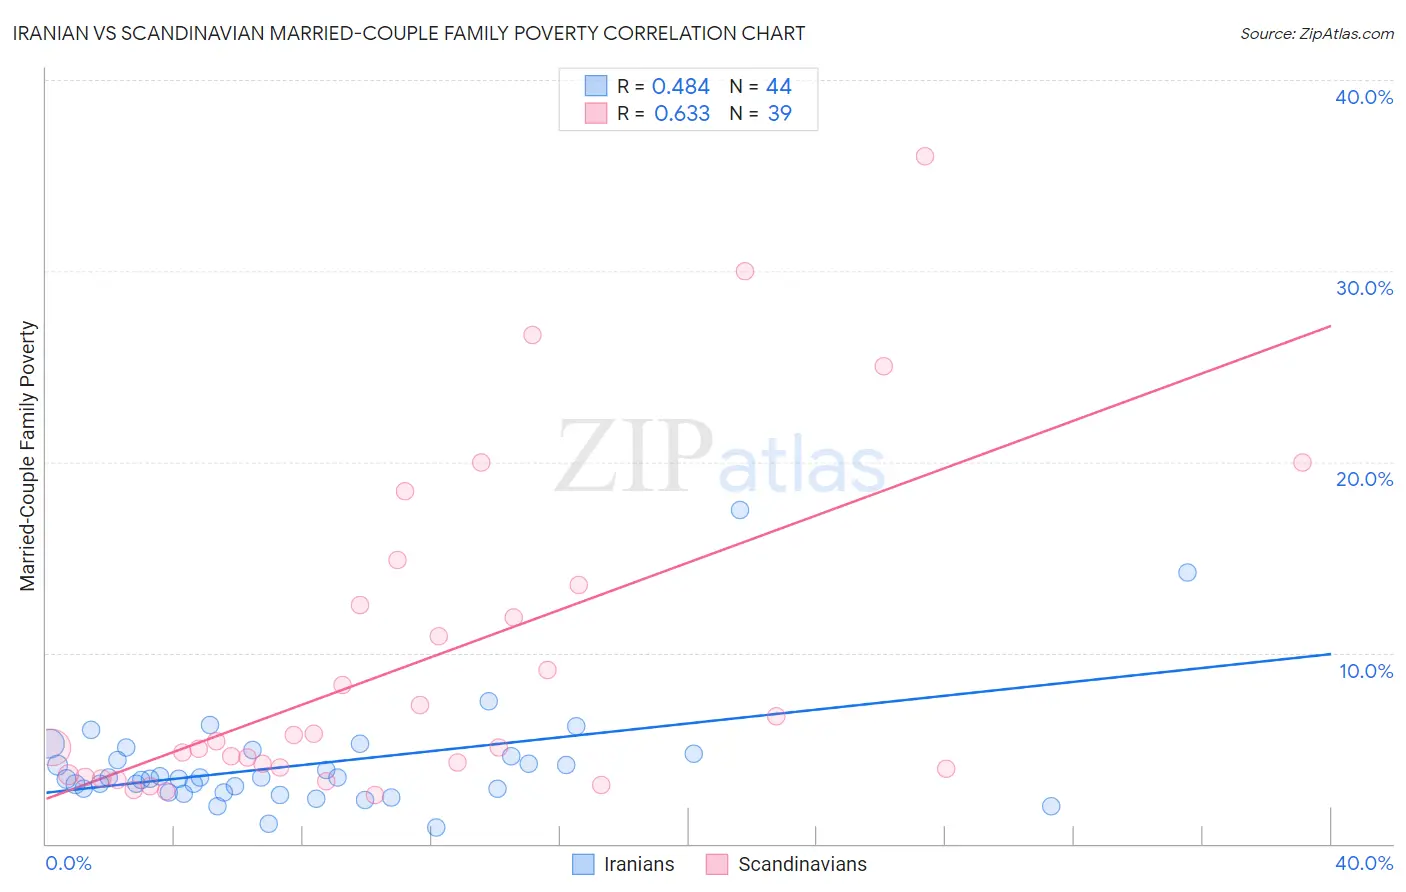
Iranian vs Scandinavian Married-Couple Family Poverty Correlation Chart
The statistical analysis conducted on geographies consisting of 314,792,069 people shows a moderate positive correlation between the proportion of Iranians and poverty level among married-couple families in the United States with a correlation coefficient (R) of 0.484 and weighted average of 4.2%. Similarly, the statistical analysis conducted on geographies consisting of 465,332,033 people shows a significant positive correlation between the proportion of Scandinavians and poverty level among married-couple families in the United States with a correlation coefficient (R) of 0.633 and weighted average of 4.1%, a difference of 1.9%.
Married-Couple Family Poverty Correlation Summary
| Measurement | Iranian | Scandinavian |
| Minimum | 0.82% | 2.5% |
| Maximum | 17.5% | 36.0% |
| Range | 16.7% | 33.5% |
| Mean | 4.2% | 9.3% |
| Median | 3.4% | 5.1% |
| Interquartile 25% (IQ1) | 2.8% | 3.6% |
| Interquartile 75% (IQ3) | 4.7% | 12.5% |
| Interquartile Range (IQR) | 1.9% | 8.9% |
| Standard Deviation (Sample) | 2.9% | 8.5% |
| Standard Deviation (Population) | 2.9% | 8.4% |
Demographics Similar to Iranians and Scandinavians by Married-Couple Family Poverty
In terms of married-couple family poverty, the demographic groups most similar to Iranians are English (4.2%, a difference of 0.070%), European (4.2%, a difference of 0.10%), Belgian (4.2%, a difference of 0.12%), Immigrants from Northern Europe (4.2%, a difference of 0.25%), and French Canadian (4.2%, a difference of 0.53%). Similarly, the demographic groups most similar to Scandinavians are Immigrants from Scotland (4.2%, a difference of 0.040%), Danish (4.1%, a difference of 0.11%), Cypriot (4.1%, a difference of 0.22%), Finnish (4.2%, a difference of 0.28%), and Estonian (4.2%, a difference of 0.36%).
| Demographics | Rating | Rank | Married-Couple Family Poverty |
| Immigrants | Singapore | 99.9 /100 | #22 | Exceptional 4.1% |
| Bhutanese | 99.9 /100 | #23 | Exceptional 4.1% |
| Eastern Europeans | 99.9 /100 | #24 | Exceptional 4.1% |
| Immigrants | Taiwan | 99.9 /100 | #25 | Exceptional 4.1% |
| Cypriots | 99.9 /100 | #26 | Exceptional 4.1% |
| Danes | 99.9 /100 | #27 | Exceptional 4.1% |
| Scandinavians | 99.9 /100 | #28 | Exceptional 4.1% |
| Immigrants | Scotland | 99.9 /100 | #29 | Exceptional 4.2% |
| Finns | 99.9 /100 | #30 | Exceptional 4.2% |
| Estonians | 99.9 /100 | #31 | Exceptional 4.2% |
| Greeks | 99.9 /100 | #32 | Exceptional 4.2% |
| Irish | 99.9 /100 | #33 | Exceptional 4.2% |
| Dutch | 99.9 /100 | #34 | Exceptional 4.2% |
| Europeans | 99.9 /100 | #35 | Exceptional 4.2% |
| English | 99.9 /100 | #36 | Exceptional 4.2% |
| Iranians | 99.9 /100 | #37 | Exceptional 4.2% |
| Belgians | 99.9 /100 | #38 | Exceptional 4.2% |
| Immigrants | Northern Europe | 99.8 /100 | #39 | Exceptional 4.2% |
| French Canadians | 99.8 /100 | #40 | Exceptional 4.2% |
| Northern Europeans | 99.8 /100 | #41 | Exceptional 4.3% |
| Scottish | 99.8 /100 | #42 | Exceptional 4.3% |