Iranian vs Tsimshian Married-Couple Family Poverty
COMPARE
Iranian
Tsimshian
Married-Couple Family Poverty
Married-Couple Family Poverty Comparison
Iranians
Tsimshian
4.2%
MARRIED-COUPLE FAMILY POVERTY
99.9/ 100
METRIC RATING
37th/ 347
METRIC RANK
5.9%
MARRIED-COUPLE FAMILY POVERTY
1.1/ 100
METRIC RATING
249th/ 347
METRIC RANK
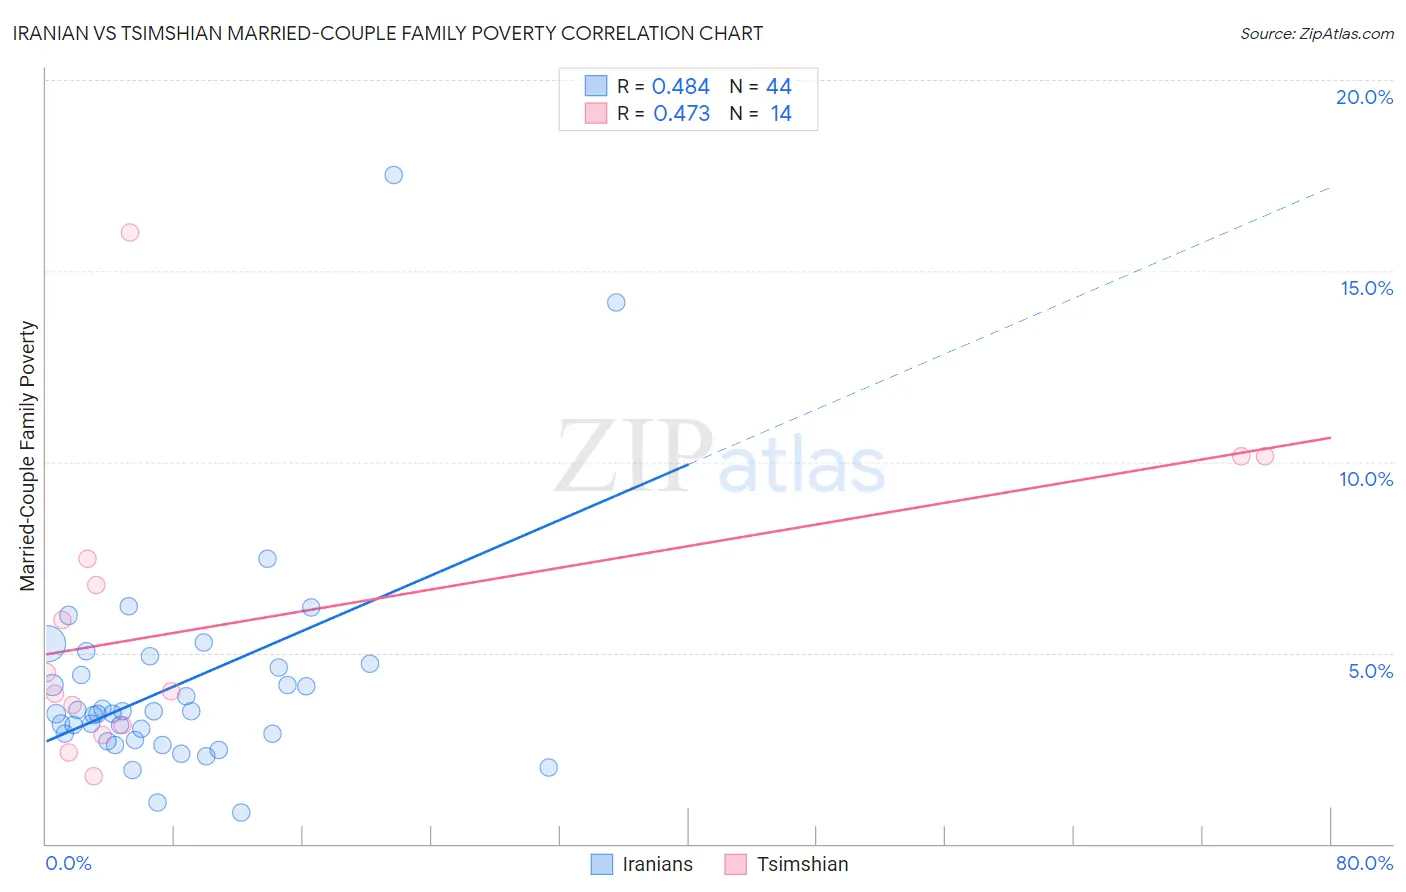
Iranian vs Tsimshian Married-Couple Family Poverty Correlation Chart
The statistical analysis conducted on geographies consisting of 314,792,069 people shows a moderate positive correlation between the proportion of Iranians and poverty level among married-couple families in the United States with a correlation coefficient (R) of 0.484 and weighted average of 4.2%. Similarly, the statistical analysis conducted on geographies consisting of 15,607,762 people shows a moderate positive correlation between the proportion of Tsimshian and poverty level among married-couple families in the United States with a correlation coefficient (R) of 0.473 and weighted average of 5.9%, a difference of 39.5%.
Married-Couple Family Poverty Correlation Summary
| Measurement | Iranian | Tsimshian |
| Minimum | 0.82% | 1.8% |
| Maximum | 17.5% | 16.0% |
| Range | 16.7% | 14.2% |
| Mean | 4.2% | 5.9% |
| Median | 3.4% | 4.2% |
| Interquartile 25% (IQ1) | 2.8% | 3.1% |
| Interquartile 75% (IQ3) | 4.7% | 7.5% |
| Interquartile Range (IQR) | 1.9% | 4.4% |
| Standard Deviation (Sample) | 2.9% | 3.9% |
| Standard Deviation (Population) | 2.9% | 3.8% |
Similar Demographics by Married-Couple Family Poverty
Demographics Similar to Iranians by Married-Couple Family Poverty
In terms of married-couple family poverty, the demographic groups most similar to Iranians are English (4.2%, a difference of 0.070%), European (4.2%, a difference of 0.10%), Belgian (4.2%, a difference of 0.12%), Immigrants from Northern Europe (4.2%, a difference of 0.25%), and French Canadian (4.2%, a difference of 0.53%).
| Demographics | Rating | Rank | Married-Couple Family Poverty |
| Finns | 99.9 /100 | #30 | Exceptional 4.2% |
| Estonians | 99.9 /100 | #31 | Exceptional 4.2% |
| Greeks | 99.9 /100 | #32 | Exceptional 4.2% |
| Irish | 99.9 /100 | #33 | Exceptional 4.2% |
| Dutch | 99.9 /100 | #34 | Exceptional 4.2% |
| Europeans | 99.9 /100 | #35 | Exceptional 4.2% |
| English | 99.9 /100 | #36 | Exceptional 4.2% |
| Iranians | 99.9 /100 | #37 | Exceptional 4.2% |
| Belgians | 99.9 /100 | #38 | Exceptional 4.2% |
| Immigrants | Northern Europe | 99.8 /100 | #39 | Exceptional 4.2% |
| French Canadians | 99.8 /100 | #40 | Exceptional 4.2% |
| Northern Europeans | 99.8 /100 | #41 | Exceptional 4.3% |
| Scottish | 99.8 /100 | #42 | Exceptional 4.3% |
| Swiss | 99.8 /100 | #43 | Exceptional 4.3% |
| Immigrants | Japan | 99.8 /100 | #44 | Exceptional 4.3% |
Demographics Similar to Tsimshian by Married-Couple Family Poverty
In terms of married-couple family poverty, the demographic groups most similar to Tsimshian are Cree (5.9%, a difference of 0.10%), Immigrants from Eritrea (5.9%, a difference of 0.21%), Immigrants from Ghana (5.9%, a difference of 0.46%), Iraqi (5.9%, a difference of 0.52%), and Immigrants from Western Asia (6.0%, a difference of 1.1%).
| Demographics | Rating | Rank | Married-Couple Family Poverty |
| Immigrants | Western Africa | 2.4 /100 | #242 | Tragic 5.8% |
| Somalis | 2.3 /100 | #243 | Tragic 5.8% |
| Chickasaw | 2.3 /100 | #244 | Tragic 5.8% |
| Immigrants | Afghanistan | 2.1 /100 | #245 | Tragic 5.8% |
| Immigrants | Venezuela | 1.8 /100 | #246 | Tragic 5.8% |
| Iraqis | 1.4 /100 | #247 | Tragic 5.9% |
| Cree | 1.2 /100 | #248 | Tragic 5.9% |
| Tsimshian | 1.1 /100 | #249 | Tragic 5.9% |
| Immigrants | Eritrea | 1.1 /100 | #250 | Tragic 5.9% |
| Immigrants | Ghana | 1.0 /100 | #251 | Tragic 5.9% |
| Immigrants | Western Asia | 0.7 /100 | #252 | Tragic 6.0% |
| Africans | 0.7 /100 | #253 | Tragic 6.0% |
| Immigrants | Somalia | 0.7 /100 | #254 | Tragic 6.0% |
| Comanche | 0.7 /100 | #255 | Tragic 6.0% |
| Bangladeshis | 0.5 /100 | #256 | Tragic 6.0% |