Iranian vs Immigrants from Guyana Married-Couple Family Poverty
COMPARE
Iranian
Immigrants from Guyana
Married-Couple Family Poverty
Married-Couple Family Poverty Comparison
Iranians
Immigrants from Guyana
4.2%
MARRIED-COUPLE FAMILY POVERTY
99.9/ 100
METRIC RATING
37th/ 347
METRIC RANK
6.7%
MARRIED-COUPLE FAMILY POVERTY
0.0/ 100
METRIC RATING
298th/ 347
METRIC RANK
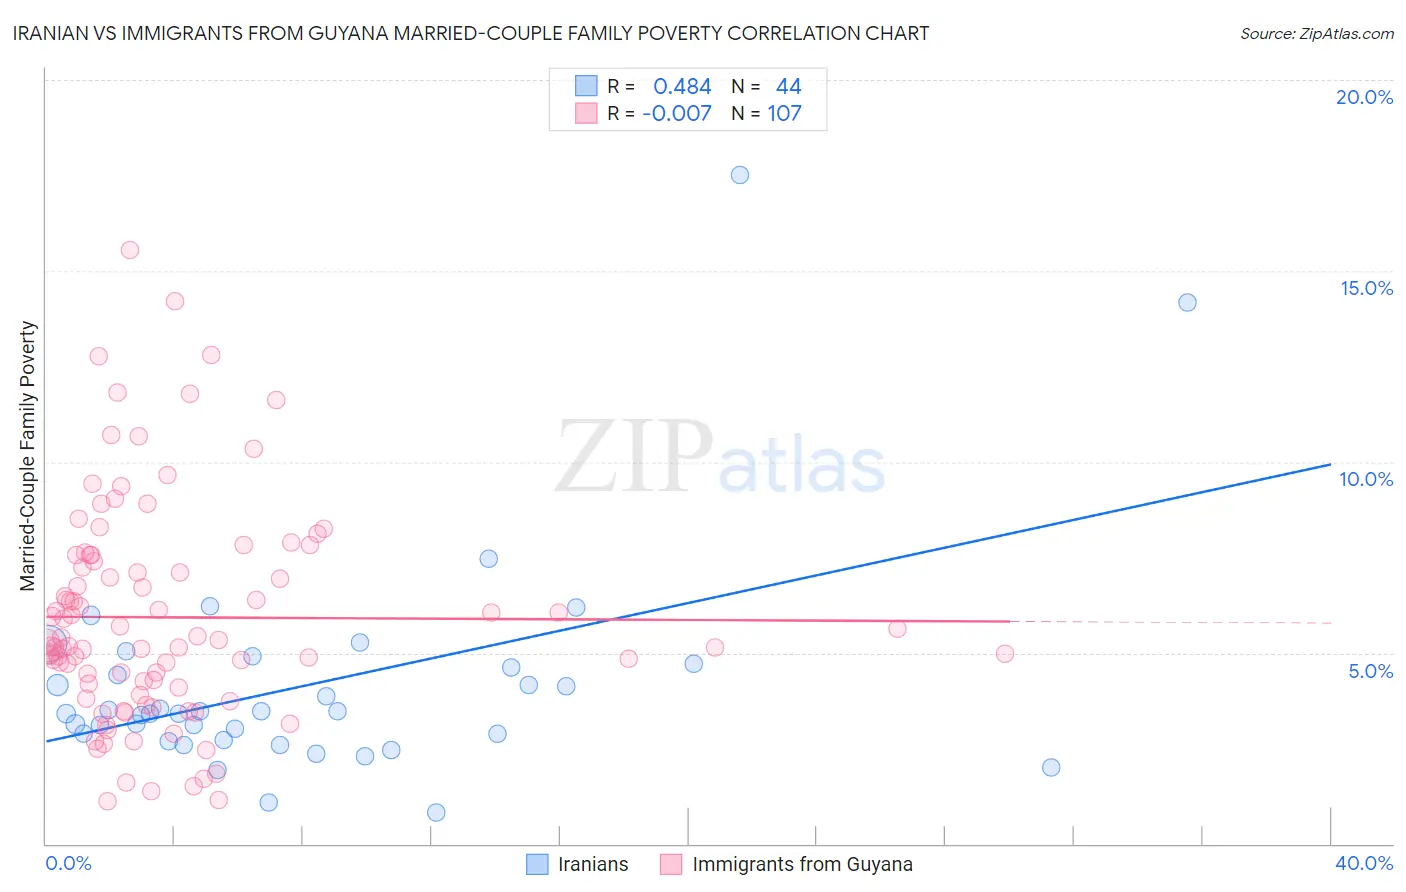
Iranian vs Immigrants from Guyana Married-Couple Family Poverty Correlation Chart
The statistical analysis conducted on geographies consisting of 314,792,069 people shows a moderate positive correlation between the proportion of Iranians and poverty level among married-couple families in the United States with a correlation coefficient (R) of 0.484 and weighted average of 4.2%. Similarly, the statistical analysis conducted on geographies consisting of 182,855,108 people shows no correlation between the proportion of Immigrants from Guyana and poverty level among married-couple families in the United States with a correlation coefficient (R) of -0.007 and weighted average of 6.7%, a difference of 57.4%.
Married-Couple Family Poverty Correlation Summary
| Measurement | Iranian | Immigrants from Guyana |
| Minimum | 0.82% | 1.1% |
| Maximum | 17.5% | 15.5% |
| Range | 16.7% | 14.4% |
| Mean | 4.2% | 5.9% |
| Median | 3.4% | 5.3% |
| Interquartile 25% (IQ1) | 2.8% | 4.1% |
| Interquartile 75% (IQ3) | 4.7% | 7.6% |
| Interquartile Range (IQR) | 1.9% | 3.5% |
| Standard Deviation (Sample) | 2.9% | 2.9% |
| Standard Deviation (Population) | 2.9% | 2.8% |
Similar Demographics by Married-Couple Family Poverty
Demographics Similar to Iranians by Married-Couple Family Poverty
In terms of married-couple family poverty, the demographic groups most similar to Iranians are English (4.2%, a difference of 0.070%), European (4.2%, a difference of 0.10%), Belgian (4.2%, a difference of 0.12%), Immigrants from Northern Europe (4.2%, a difference of 0.25%), and French Canadian (4.2%, a difference of 0.53%).
| Demographics | Rating | Rank | Married-Couple Family Poverty |
| Finns | 99.9 /100 | #30 | Exceptional 4.2% |
| Estonians | 99.9 /100 | #31 | Exceptional 4.2% |
| Greeks | 99.9 /100 | #32 | Exceptional 4.2% |
| Irish | 99.9 /100 | #33 | Exceptional 4.2% |
| Dutch | 99.9 /100 | #34 | Exceptional 4.2% |
| Europeans | 99.9 /100 | #35 | Exceptional 4.2% |
| English | 99.9 /100 | #36 | Exceptional 4.2% |
| Iranians | 99.9 /100 | #37 | Exceptional 4.2% |
| Belgians | 99.9 /100 | #38 | Exceptional 4.2% |
| Immigrants | Northern Europe | 99.8 /100 | #39 | Exceptional 4.2% |
| French Canadians | 99.8 /100 | #40 | Exceptional 4.2% |
| Northern Europeans | 99.8 /100 | #41 | Exceptional 4.3% |
| Scottish | 99.8 /100 | #42 | Exceptional 4.3% |
| Swiss | 99.8 /100 | #43 | Exceptional 4.3% |
| Immigrants | Japan | 99.8 /100 | #44 | Exceptional 4.3% |
Demographics Similar to Immigrants from Guyana by Married-Couple Family Poverty
In terms of married-couple family poverty, the demographic groups most similar to Immigrants from Guyana are U.S. Virgin Islander (6.6%, a difference of 0.070%), Kiowa (6.6%, a difference of 0.070%), Immigrants from Uzbekistan (6.6%, a difference of 0.18%), Bahamian (6.6%, a difference of 0.47%), and Nicaraguan (6.7%, a difference of 0.55%).
| Demographics | Rating | Rank | Married-Couple Family Poverty |
| Belizeans | 0.0 /100 | #291 | Tragic 6.5% |
| Immigrants | Lebanon | 0.0 /100 | #292 | Tragic 6.6% |
| Arapaho | 0.0 /100 | #293 | Tragic 6.6% |
| Bahamians | 0.0 /100 | #294 | Tragic 6.6% |
| Immigrants | Uzbekistan | 0.0 /100 | #295 | Tragic 6.6% |
| U.S. Virgin Islanders | 0.0 /100 | #296 | Tragic 6.6% |
| Kiowa | 0.0 /100 | #297 | Tragic 6.6% |
| Immigrants | Guyana | 0.0 /100 | #298 | Tragic 6.7% |
| Nicaraguans | 0.0 /100 | #299 | Tragic 6.7% |
| Immigrants | Belize | 0.0 /100 | #300 | Tragic 6.7% |
| Central Americans | 0.0 /100 | #301 | Tragic 6.7% |
| Immigrants | Ecuador | 0.0 /100 | #302 | Tragic 6.7% |
| Immigrants | El Salvador | 0.0 /100 | #303 | Tragic 6.8% |
| Cubans | 0.0 /100 | #304 | Tragic 6.8% |
| Haitians | 0.0 /100 | #305 | Tragic 6.8% |