Immigrants from Western Africa Disability Age 5 to 17
COMPARE
Immigrants from Western Africa
Select to Compare
Disability Age 5 to 17
Immigrants from Western Africa Disability Age 5 to 17
5.9%
DISABILITY | AGE 5 TO 17
0.7/ 100
METRIC RATING
262nd/ 347
METRIC RANK
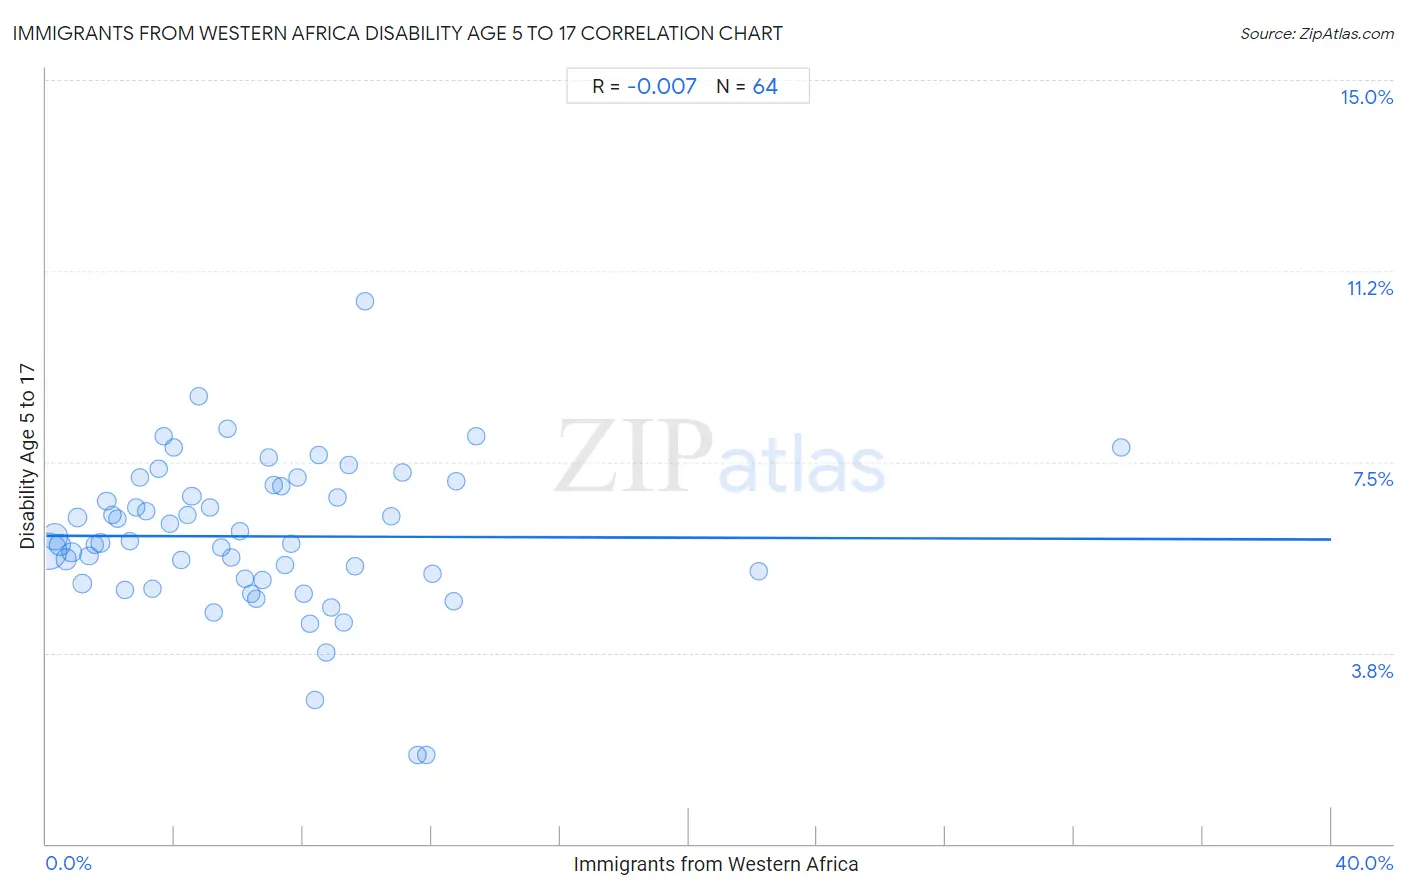
Immigrants from Western Africa Disability Age 5 to 17 Correlation Chart
The statistical analysis conducted on geographies consisting of 355,657,853 people shows no correlation between the proportion of Immigrants from Western Africa and percentage of population with a disability between the ages 5 and 17 in the United States with a correlation coefficient (R) of -0.007 and weighted average of 5.9%. On average, for every 1% (one percent) increase in Immigrants from Western Africa within a typical geography, there is a decrease of 0.0018% in percentage of population with a disability between the ages 5 and 17.
It is essential to understand that the correlation between the percentage of Immigrants from Western Africa and percentage of population with a disability between the ages 5 and 17 does not imply a direct cause-and-effect relationship. It remains uncertain whether the presence of Immigrants from Western Africa influences an upward or downward trend in the level of percentage of population with a disability between the ages 5 and 17 within an area, or if Immigrants from Western Africa simply ended up residing in those areas with higher or lower levels of percentage of population with a disability between the ages 5 and 17 due to other factors.
Demographics Similar to Immigrants from Western Africa by Disability Age 5 to 17
In terms of disability age 5 to 17, the demographic groups most similar to Immigrants from Western Africa are Immigrants from Middle Africa (5.9%, a difference of 0.030%), Czechoslovakian (5.9%, a difference of 0.080%), Somali (5.9%, a difference of 0.10%), Canadian (6.0%, a difference of 0.20%), and Slavic (5.9%, a difference of 0.23%).
| Demographics | Rating | Rank | Disability Age 5 to 17 |
| Italians | 1.2 /100 | #255 | Tragic 5.9% |
| Hopi | 1.0 /100 | #256 | Tragic 5.9% |
| Hispanics or Latinos | 1.0 /100 | #257 | Tragic 5.9% |
| Brazilians | 0.9 /100 | #258 | Tragic 5.9% |
| Slavs | 0.9 /100 | #259 | Tragic 5.9% |
| Somalis | 0.8 /100 | #260 | Tragic 5.9% |
| Immigrants from Middle Africa | 0.7 /100 | #261 | Tragic 5.9% |
| Immigrants from Western Africa | 0.7 /100 | #262 | Tragic 5.9% |
| Czechoslovakians | 0.7 /100 | #263 | Tragic 5.9% |
| Canadians | 0.6 /100 | #264 | Tragic 6.0% |
| Panamanians | 0.6 /100 | #265 | Tragic 6.0% |
| Slovenes | 0.6 /100 | #266 | Tragic 6.0% |
| Spanish | 0.5 /100 | #267 | Tragic 6.0% |
| Sioux | 0.4 /100 | #268 | Tragic 6.0% |
| Liberians | 0.4 /100 | #269 | Tragic 6.0% |
Immigrants from Western Africa Disability Age 5 to 17 Correlation Summary
| Measurement | Immigrants from Western Africa Data | Disability Age 5 to 17 Data |
| Minimum | 0.083% | 1.7% |
| Maximum | 33.5% | 10.7% |
| Range | 33.4% | 8.9% |
| Mean | 6.5% | 6.0% |
| Median | 5.9% | 5.9% |
| Interquartile 25% (IQ1) | 2.9% | 5.2% |
| Interquartile 75% (IQ3) | 8.8% | 7.0% |
| Interquartile Range (IQR) | 5.9% | 1.8% |
| Standard Deviation (Sample) | 5.4% | 1.5% |
| Standard Deviation (Population) | 5.3% | 1.5% |
Correlation Details
| Immigrants from Western Africa Percentile | Sample Size | Disability Age 5 to 17 |
[ 0.0% - 0.5% ] 0.083% | 161,739,790 | 5.7% |
[ 0.0% - 0.5% ] 0.26% | 66,999,157 | 6.0% |
[ 0.0% - 0.5% ] 0.43% | 34,457,005 | 5.9% |
[ 0.5% - 1.0% ] 0.62% | 22,374,855 | 5.6% |
[ 0.5% - 1.0% ] 0.80% | 14,214,002 | 5.7% |
[ 0.5% - 1.0% ] 0.99% | 11,454,434 | 6.4% |
[ 1.0% - 1.5% ] 1.11% | 14,118,018 | 5.1% |
[ 1.0% - 1.5% ] 1.33% | 5,565,011 | 5.7% |
[ 1.5% - 2.0% ] 1.51% | 3,583,891 | 5.9% |
[ 1.5% - 2.0% ] 1.69% | 3,561,140 | 5.9% |
[ 1.5% - 2.0% ] 1.88% | 2,734,228 | 6.7% |
[ 2.0% - 2.5% ] 2.05% | 1,707,393 | 6.5% |
[ 2.0% - 2.5% ] 2.23% | 1,724,884 | 6.4% |
[ 2.0% - 2.5% ] 2.44% | 973,731 | 5.0% |
[ 2.5% - 3.0% ] 2.61% | 1,635,668 | 6.0% |
[ 2.5% - 3.0% ] 2.79% | 592,053 | 6.6% |
[ 2.5% - 3.0% ] 2.92% | 617,063 | 7.2% |
[ 3.0% - 3.5% ] 3.13% | 516,444 | 6.5% |
[ 3.0% - 3.5% ] 3.32% | 441,969 | 5.0% |
[ 3.0% - 3.5% ] 3.49% | 427,455 | 7.4% |
[ 3.5% - 4.0% ] 3.67% | 535,182 | 8.0% |
[ 3.5% - 4.0% ] 3.85% | 690,516 | 6.3% |
[ 3.5% - 4.0% ] 3.98% | 198,516 | 7.8% |
[ 4.0% - 4.5% ] 4.21% | 446,739 | 5.6% |
[ 4.0% - 4.5% ] 4.38% | 331,084 | 6.5% |
[ 4.5% - 5.0% ] 4.53% | 670,988 | 6.8% |
[ 4.5% - 5.0% ] 4.74% | 140,876 | 8.8% |
[ 5.0% - 5.5% ] 5.09% | 104,087 | 6.6% |
[ 5.0% - 5.5% ] 5.23% | 169,206 | 4.5% |
[ 5.0% - 5.5% ] 5.47% | 124,366 | 5.8% |
[ 5.5% - 6.0% ] 5.63% | 160,937 | 8.2% |
[ 5.5% - 6.0% ] 5.77% | 93,093 | 5.6% |
[ 6.0% - 6.5% ] 6.02% | 330,250 | 6.1% |
[ 6.0% - 6.5% ] 6.17% | 72,617 | 5.2% |
[ 6.0% - 6.5% ] 6.38% | 102,484 | 4.9% |
[ 6.5% - 7.0% ] 6.54% | 178,929 | 4.8% |
[ 6.5% - 7.0% ] 6.72% | 149,046 | 5.2% |
[ 6.5% - 7.0% ] 6.91% | 184,905 | 7.6% |
[ 7.0% - 7.5% ] 7.09% | 1,735 | 7.0% |
[ 7.0% - 7.5% ] 7.31% | 33,837 | 7.0% |
[ 7.0% - 7.5% ] 7.43% | 146,673 | 5.5% |
[ 7.5% - 8.0% ] 7.62% | 113,192 | 5.9% |
[ 7.5% - 8.0% ] 7.82% | 85,577 | 7.2% |
[ 7.5% - 8.0% ] 8.00% | 51,040 | 4.9% |
[ 8.0% - 8.5% ] 8.20% | 56,022 | 4.3% |
[ 8.0% - 8.5% ] 8.35% | 76,600 | 2.8% |
[ 8.0% - 8.5% ] 8.49% | 104,594 | 7.6% |
[ 8.5% - 9.0% ] 8.73% | 37,749 | 3.7% |
[ 8.5% - 9.0% ] 8.88% | 160,877 | 4.6% |
[ 9.0% - 9.5% ] 9.06% | 73,971 | 6.8% |
[ 9.0% - 9.5% ] 9.25% | 57,184 | 4.3% |
[ 9.0% - 9.5% ] 9.41% | 139,811 | 7.4% |
[ 9.5% - 10.0% ] 9.61% | 50,885 | 5.4% |
[ 9.5% - 10.0% ] 9.93% | 23,371 | 10.7% |
[ 10.5% - 11.0% ] 10.75% | 35,488 | 6.4% |
[ 11.0% - 11.5% ] 11.10% | 10,682 | 7.3% |
[ 11.5% - 12.0% ] 11.57% | 9,781 | 1.7% |
[ 11.5% - 12.0% ] 11.82% | 9,574 | 1.7% |
[ 12.0% - 12.5% ] 12.03% | 104,713 | 5.3% |
[ 12.5% - 13.0% ] 12.69% | 69,225 | 4.8% |
[ 12.5% - 13.0% ] 12.77% | 47,677 | 7.1% |
[ 13.0% - 13.5% ] 13.37% | 32,247 | 8.0% |
[ 22.0% - 22.5% ] 22.18% | 2,849 | 5.4% |
[ 33.0% - 33.5% ] 33.47% | 487 | 7.8% |