Immigrants from Western Africa Married-couple Households
COMPARE
Immigrants from Western Africa
Select to Compare
Married-couple Households
Immigrants from Western Africa Married-couple Households
41.4%
MARRIED-COUPLE HOUSEHOLDS
0.0/ 100
METRIC RATING
307th/ 347
METRIC RANK
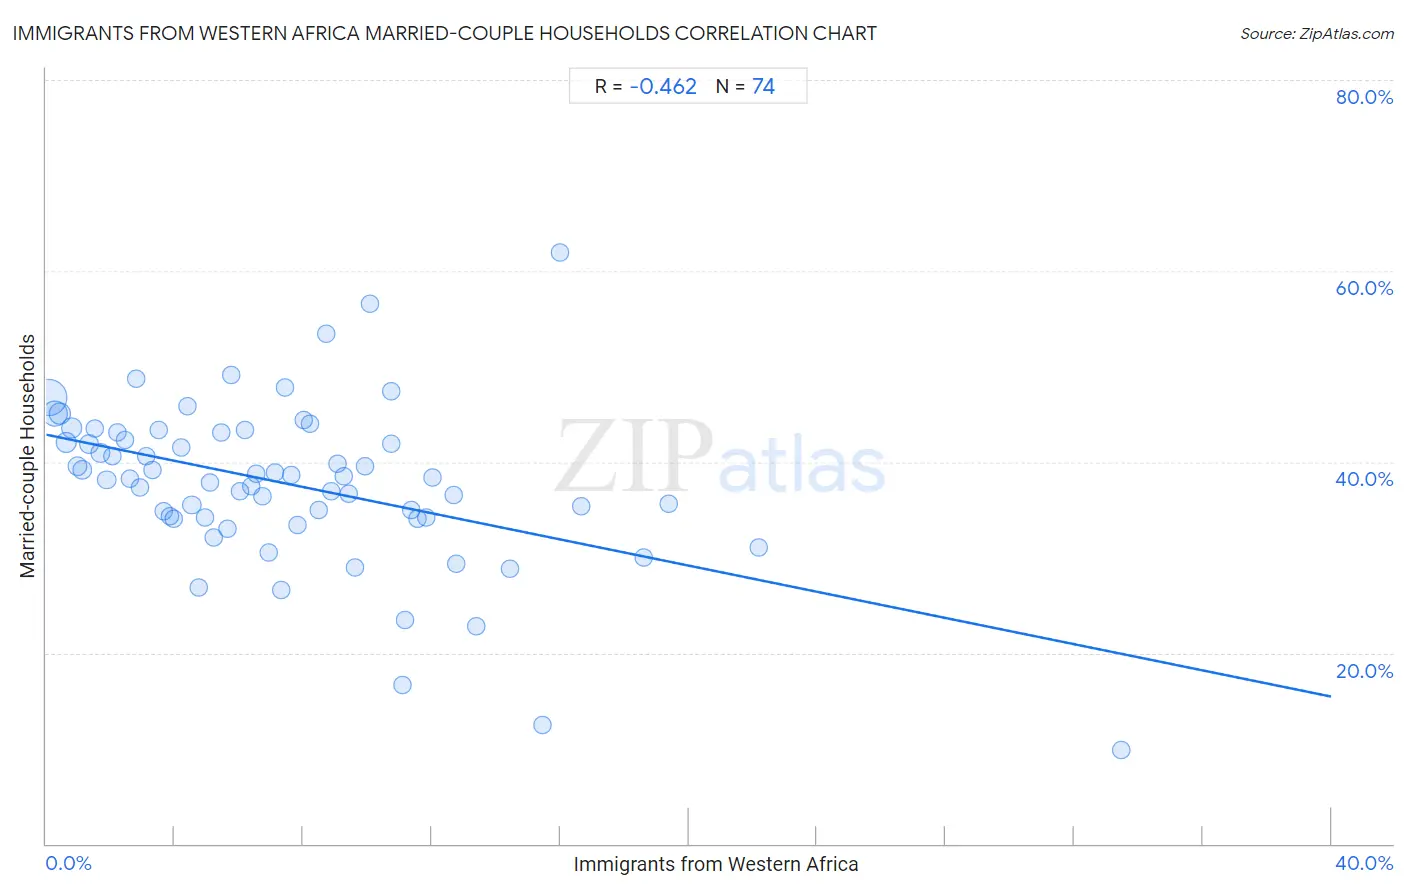
Immigrants from Western Africa Married-couple Households Correlation Chart
The statistical analysis conducted on geographies consisting of 357,444,819 people shows a moderate negative correlation between the proportion of Immigrants from Western Africa and percentage of married-couple family households in the United States with a correlation coefficient (R) of -0.462 and weighted average of 41.4%. On average, for every 1% (one percent) increase in Immigrants from Western Africa within a typical geography, there is a decrease of 0.69% in percentage of married-couple family households.
It is essential to understand that the correlation between the percentage of Immigrants from Western Africa and percentage of married-couple family households does not imply a direct cause-and-effect relationship. It remains uncertain whether the presence of Immigrants from Western Africa influences an upward or downward trend in the level of percentage of married-couple family households within an area, or if Immigrants from Western Africa simply ended up residing in those areas with higher or lower levels of percentage of married-couple family households due to other factors.
Demographics Similar to Immigrants from Western Africa by Married-couple Households
In terms of married-couple households, the demographic groups most similar to Immigrants from Western Africa are Guyanese (41.4%, a difference of 0.010%), Crow (41.4%, a difference of 0.010%), Immigrants from Trinidad and Tobago (41.2%, a difference of 0.36%), Sioux (41.5%, a difference of 0.38%), and Haitian (41.2%, a difference of 0.43%).
| Demographics | Rating | Rank | Married-couple Households |
| Immigrants from Belize | 0.0 /100 | #300 | Tragic 41.8% |
| Immigrants from Bahamas | 0.0 /100 | #301 | Tragic 41.7% |
| Immigrants from Honduras | 0.0 /100 | #302 | Tragic 41.6% |
| Sub-Saharan Africans | 0.0 /100 | #303 | Tragic 41.6% |
| Immigrants from Guyana | 0.0 /100 | #304 | Tragic 41.6% |
| Sioux | 0.0 /100 | #305 | Tragic 41.5% |
| Guyanese | 0.0 /100 | #306 | Tragic 41.4% |
| Immigrants from Western Africa | 0.0 /100 | #307 | Tragic 41.4% |
| Crow | 0.0 /100 | #308 | Tragic 41.4% |
| Immigrants from Trinidad and Tobago | 0.0 /100 | #309 | Tragic 41.2% |
| Haitians | 0.0 /100 | #310 | Tragic 41.2% |
| Colville | 0.0 /100 | #311 | Tragic 41.0% |
| Africans | 0.0 /100 | #312 | Tragic 40.9% |
| Immigrants from Haiti | 0.0 /100 | #313 | Tragic 40.9% |
| Jamaicans | 0.0 /100 | #314 | Tragic 40.9% |
Immigrants from Western Africa Married-couple Households Correlation Summary
| Measurement | Immigrants from Western Africa Data | Married-couple Households Data |
| Minimum | 0.083% | 9.9% |
| Maximum | 33.5% | 61.9% |
| Range | 33.4% | 52.0% |
| Mean | 7.5% | 37.7% |
| Median | 6.6% | 38.4% |
| Interquartile 25% (IQ1) | 3.3% | 34.2% |
| Interquartile 75% (IQ3) | 10.7% | 43.0% |
| Interquartile Range (IQR) | 7.4% | 8.9% |
| Standard Deviation (Sample) | 5.8% | 8.6% |
| Standard Deviation (Population) | 5.8% | 8.5% |
Correlation Details
| Immigrants from Western Africa Percentile | Sample Size | Married-couple Households |
[ 0.0% - 0.5% ] 0.083% | 162,342,867 | 46.7% |
[ 0.0% - 0.5% ] 0.26% | 67,317,400 | 45.0% |
[ 0.0% - 0.5% ] 0.43% | 34,678,662 | 45.0% |
[ 0.5% - 1.0% ] 0.62% | 22,504,290 | 42.0% |
[ 0.5% - 1.0% ] 0.80% | 14,275,212 | 43.5% |
[ 0.5% - 1.0% ] 0.99% | 11,503,523 | 39.5% |
[ 1.0% - 1.5% ] 1.11% | 14,190,239 | 39.2% |
[ 1.0% - 1.5% ] 1.33% | 5,600,033 | 41.8% |
[ 1.5% - 2.0% ] 1.51% | 3,618,650 | 43.5% |
[ 1.5% - 2.0% ] 1.69% | 3,575,203 | 40.9% |
[ 1.5% - 2.0% ] 1.88% | 2,754,874 | 38.1% |
[ 2.0% - 2.5% ] 2.05% | 1,707,918 | 40.6% |
[ 2.0% - 2.5% ] 2.23% | 1,738,472 | 43.1% |
[ 2.0% - 2.5% ] 2.44% | 976,218 | 42.2% |
[ 2.5% - 3.0% ] 2.61% | 1,646,939 | 38.3% |
[ 2.5% - 3.0% ] 2.79% | 608,855 | 48.8% |
[ 2.5% - 3.0% ] 2.92% | 624,830 | 37.3% |
[ 3.0% - 3.5% ] 3.13% | 544,375 | 40.5% |
[ 3.0% - 3.5% ] 3.32% | 445,890 | 39.2% |
[ 3.0% - 3.5% ] 3.49% | 427,455 | 43.4% |
[ 3.5% - 4.0% ] 3.67% | 540,223 | 34.8% |
[ 3.5% - 4.0% ] 3.85% | 696,721 | 34.3% |
[ 3.5% - 4.0% ] 3.98% | 207,105 | 34.1% |
[ 4.0% - 4.5% ] 4.21% | 450,236 | 41.5% |
[ 4.0% - 4.5% ] 4.38% | 340,635 | 45.8% |
[ 4.5% - 5.0% ] 4.53% | 673,498 | 35.5% |
[ 4.5% - 5.0% ] 4.74% | 144,321 | 26.8% |
[ 4.5% - 5.0% ] 4.95% | 115,169 | 34.2% |
[ 5.0% - 5.5% ] 5.09% | 105,662 | 37.9% |
[ 5.0% - 5.5% ] 5.23% | 169,206 | 32.0% |
[ 5.0% - 5.5% ] 5.47% | 124,680 | 43.0% |
[ 5.5% - 6.0% ] 5.63% | 177,962 | 33.0% |
[ 5.5% - 6.0% ] 5.77% | 93,093 | 49.1% |
[ 6.0% - 6.5% ] 6.02% | 330,250 | 37.0% |
[ 6.0% - 6.5% ] 6.17% | 72,617 | 43.3% |
[ 6.0% - 6.5% ] 6.38% | 111,574 | 37.4% |
[ 6.5% - 7.0% ] 6.54% | 178,929 | 38.8% |
[ 6.5% - 7.0% ] 6.72% | 149,046 | 36.4% |
[ 6.5% - 7.0% ] 6.91% | 188,367 | 30.5% |
[ 7.0% - 7.5% ] 7.13% | 5,357 | 38.8% |
[ 7.0% - 7.5% ] 7.31% | 33,837 | 26.6% |
[ 7.0% - 7.5% ] 7.43% | 146,861 | 47.8% |
[ 7.5% - 8.0% ] 7.62% | 113,192 | 38.6% |
[ 7.5% - 8.0% ] 7.82% | 85,577 | 33.4% |
[ 7.5% - 8.0% ] 8.00% | 51,040 | 44.4% |
[ 8.0% - 8.5% ] 8.20% | 56,022 | 44.0% |
[ 8.0% - 8.5% ] 8.48% | 118,174 | 34.9% |
[ 8.5% - 9.0% ] 8.72% | 38,340 | 53.4% |
[ 8.5% - 9.0% ] 8.88% | 160,368 | 36.9% |
[ 9.0% - 9.5% ] 9.06% | 73,971 | 39.8% |
[ 9.0% - 9.5% ] 9.25% | 57,718 | 38.5% |
[ 9.0% - 9.5% ] 9.41% | 139,811 | 36.6% |
[ 9.5% - 10.0% ] 9.61% | 50,885 | 28.9% |
[ 9.5% - 10.0% ] 9.93% | 23,371 | 39.6% |
[ 10.0% - 10.5% ] 10.08% | 1,875 | 56.5% |
[ 10.5% - 11.0% ] 10.73% | 2,219 | 47.5% |
[ 10.5% - 11.0% ] 10.75% | 35,488 | 42.0% |
[ 11.0% - 11.5% ] 11.10% | 10,682 | 16.6% |
[ 11.0% - 11.5% ] 11.15% | 3,156 | 23.4% |
[ 11.0% - 11.5% ] 11.36% | 44 | 35.0% |
[ 11.5% - 12.0% ] 11.57% | 9,781 | 34.1% |
[ 11.5% - 12.0% ] 11.82% | 9,574 | 34.2% |
[ 12.0% - 12.5% ] 12.03% | 104,713 | 38.4% |
[ 12.5% - 13.0% ] 12.69% | 69,225 | 36.6% |
[ 12.5% - 13.0% ] 12.77% | 47,677 | 29.3% |
[ 13.0% - 13.5% ] 13.37% | 32,668 | 22.8% |
[ 14.0% - 14.5% ] 14.44% | 2,348 | 28.8% |
[ 15.0% - 15.5% ] 15.44% | 1,658 | 12.5% |
[ 15.5% - 16.0% ] 15.99% | 3,914 | 61.9% |
[ 16.5% - 17.0% ] 16.67% | 48 | 35.3% |
[ 18.5% - 19.0% ] 18.59% | 468 | 30.0% |
[ 19.0% - 19.5% ] 19.37% | 222 | 35.6% |
[ 22.0% - 22.5% ] 22.18% | 2,849 | 31.1% |
[ 33.0% - 33.5% ] 33.47% | 487 | 9.9% |