Immigrants from Western Africa Wage/Income Gap
COMPARE
Immigrants from Western Africa
Select to Compare
Wage/Income Gap
Immigrants from Western Africa Wage/Income Gap
22.0%
WAGE/INCOME GAP
100.0/ 100
METRIC RATING
50th/ 347
METRIC RANK
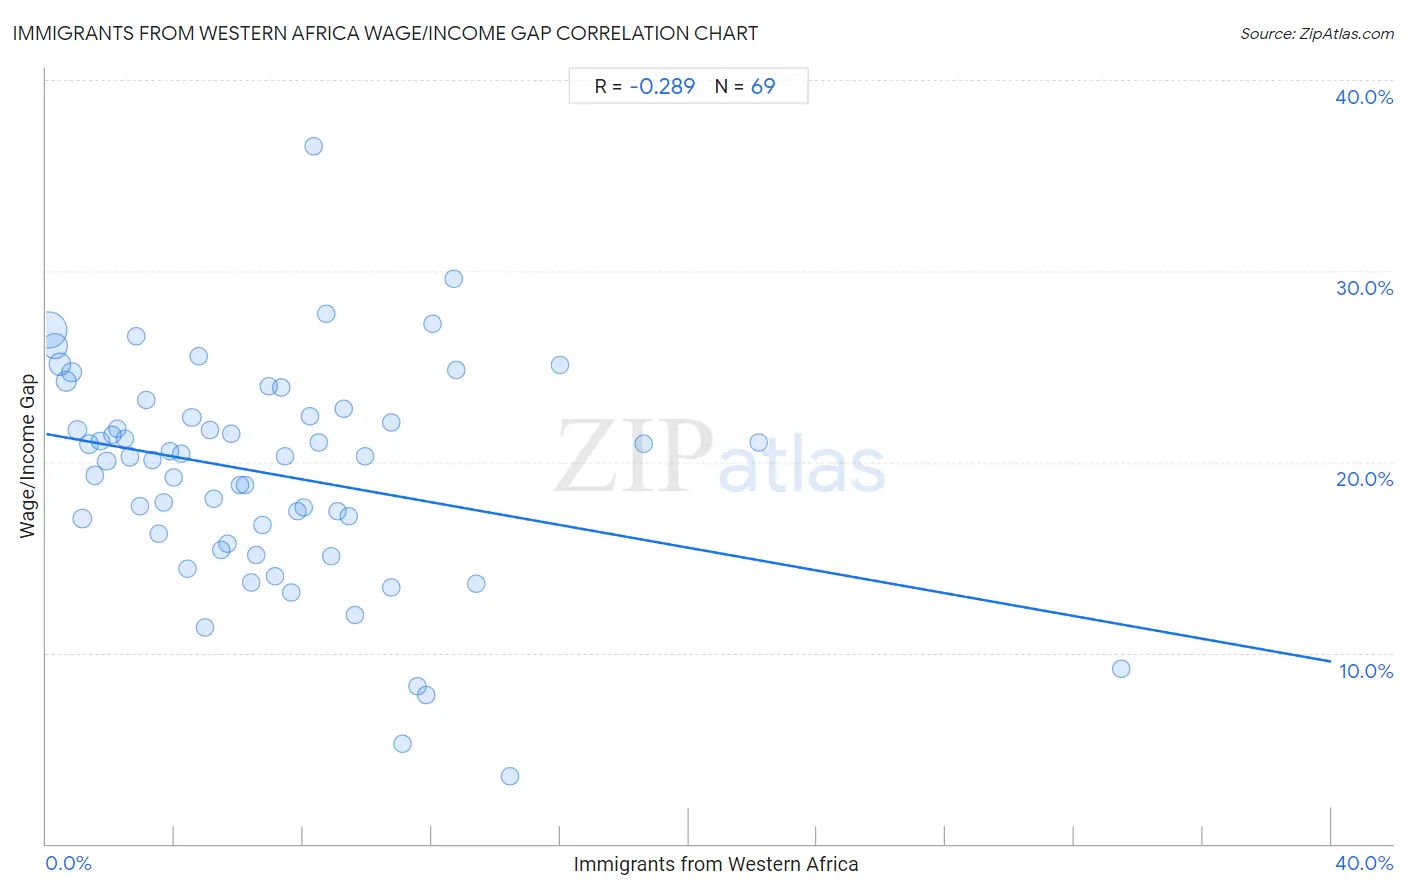
Immigrants from Western Africa Wage/Income Gap Correlation Chart
The statistical analysis conducted on geographies consisting of 357,735,859 people shows a weak negative correlation between the proportion of Immigrants from Western Africa and wage/income gap percentage in the United States with a correlation coefficient (R) of -0.289 and weighted average of 22.0%. On average, for every 1% (one percent) increase in Immigrants from Western Africa within a typical geography, there is a decrease of 0.30% in wage/income gap percentage.
It is essential to understand that the correlation between the percentage of Immigrants from Western Africa and wage/income gap percentage does not imply a direct cause-and-effect relationship. It remains uncertain whether the presence of Immigrants from Western Africa influences an upward or downward trend in the level of wage/income gap percentage within an area, or if Immigrants from Western Africa simply ended up residing in those areas with higher or lower levels of wage/income gap percentage due to other factors.
Demographics Similar to Immigrants from Western Africa by Wage/Income Gap
In terms of wage/income gap, the demographic groups most similar to Immigrants from Western Africa are Tohono O'odham (22.1%, a difference of 0.44%), Immigrants from Cameroon (22.2%, a difference of 0.52%), Bangladeshi (22.2%, a difference of 0.53%), Nepalese (22.2%, a difference of 0.76%), and Ethiopian (21.8%, a difference of 0.98%).
| Demographics | Rating | Rank | Wage/Income Gap |
| Sierra Leoneans | 100.0 /100 | #43 | Exceptional 21.4% |
| Immigrants from Eritrea | 100.0 /100 | #44 | Exceptional 21.4% |
| U.S. Virgin Islanders | 100.0 /100 | #45 | Exceptional 21.5% |
| Immigrants from Ethiopia | 100.0 /100 | #46 | Exceptional 21.6% |
| Immigrants from Congo | 100.0 /100 | #47 | Exceptional 21.7% |
| Blacks/African Americans | 100.0 /100 | #48 | Exceptional 21.7% |
| Ethiopians | 100.0 /100 | #49 | Exceptional 21.8% |
| Immigrants from Western Africa | 100.0 /100 | #50 | Exceptional 22.0% |
| Tohono O'odham | 100.0 /100 | #51 | Exceptional 22.1% |
| Immigrants from Cameroon | 100.0 /100 | #52 | Exceptional 22.2% |
| Bangladeshis | 100.0 /100 | #53 | Exceptional 22.2% |
| Nepalese | 100.0 /100 | #54 | Exceptional 22.2% |
| Immigrants from Zaire | 100.0 /100 | #55 | Exceptional 22.3% |
| Immigrants from Ghana | 100.0 /100 | #56 | Exceptional 22.3% |
| Ghanaians | 100.0 /100 | #57 | Exceptional 22.3% |
Immigrants from Western Africa Wage/Income Gap Correlation Summary
| Measurement | Immigrants from Western Africa Data | Wage/Income Gap Data |
| Minimum | 0.083% | 3.6% |
| Maximum | 33.5% | 36.5% |
| Range | 33.4% | 33.0% |
| Mean | 7.0% | 19.4% |
| Median | 6.2% | 20.3% |
| Interquartile 25% (IQ1) | 3.0% | 16.0% |
| Interquartile 75% (IQ3) | 9.3% | 22.6% |
| Interquartile Range (IQR) | 6.3% | 6.6% |
| Standard Deviation (Sample) | 5.6% | 5.7% |
| Standard Deviation (Population) | 5.5% | 5.7% |
Correlation Details
| Immigrants from Western Africa Percentile | Sample Size | Wage/Income Gap |
[ 0.0% - 0.5% ] 0.083% | 162,404,375 | 26.9% |
[ 0.0% - 0.5% ] 0.26% | 67,396,557 | 26.0% |
[ 0.0% - 0.5% ] 0.43% | 34,707,217 | 25.1% |
[ 0.5% - 1.0% ] 0.62% | 22,506,592 | 24.2% |
[ 0.5% - 1.0% ] 0.80% | 14,291,046 | 24.7% |
[ 0.5% - 1.0% ] 0.99% | 11,526,552 | 21.6% |
[ 1.0% - 1.5% ] 1.11% | 14,205,926 | 17.0% |
[ 1.0% - 1.5% ] 1.33% | 5,598,631 | 20.9% |
[ 1.5% - 2.0% ] 1.51% | 3,613,386 | 19.3% |
[ 1.5% - 2.0% ] 1.69% | 3,577,607 | 21.1% |
[ 1.5% - 2.0% ] 1.88% | 2,757,257 | 20.0% |
[ 2.0% - 2.5% ] 2.05% | 1,707,794 | 21.4% |
[ 2.0% - 2.5% ] 2.23% | 1,740,683 | 21.8% |
[ 2.0% - 2.5% ] 2.44% | 973,914 | 21.2% |
[ 2.5% - 3.0% ] 2.61% | 1,646,939 | 20.3% |
[ 2.5% - 3.0% ] 2.79% | 607,662 | 26.6% |
[ 2.5% - 3.0% ] 2.92% | 623,587 | 17.7% |
[ 3.0% - 3.5% ] 3.13% | 544,375 | 23.2% |
[ 3.0% - 3.5% ] 3.32% | 443,789 | 20.1% |
[ 3.0% - 3.5% ] 3.49% | 427,028 | 16.3% |
[ 3.5% - 4.0% ] 3.67% | 542,618 | 17.9% |
[ 3.5% - 4.0% ] 3.85% | 696,721 | 20.6% |
[ 3.5% - 4.0% ] 3.98% | 206,169 | 19.2% |
[ 4.0% - 4.5% ] 4.21% | 449,979 | 20.4% |
[ 4.0% - 4.5% ] 4.38% | 339,376 | 14.4% |
[ 4.5% - 5.0% ] 4.53% | 674,032 | 22.3% |
[ 4.5% - 5.0% ] 4.74% | 144,153 | 25.6% |
[ 4.5% - 5.0% ] 4.95% | 115,169 | 11.3% |
[ 5.0% - 5.5% ] 5.09% | 105,662 | 21.7% |
[ 5.0% - 5.5% ] 5.23% | 169,206 | 18.1% |
[ 5.0% - 5.5% ] 5.47% | 124,366 | 15.4% |
[ 5.5% - 6.0% ] 5.63% | 182,272 | 15.7% |
[ 5.5% - 6.0% ] 5.77% | 89,806 | 21.5% |
[ 6.0% - 6.5% ] 6.02% | 331,321 | 18.8% |
[ 6.0% - 6.5% ] 6.17% | 72,617 | 18.8% |
[ 6.0% - 6.5% ] 6.38% | 111,574 | 13.7% |
[ 6.5% - 7.0% ] 6.54% | 178,929 | 15.1% |
[ 6.5% - 7.0% ] 6.72% | 149,046 | 16.7% |
[ 6.5% - 7.0% ] 6.91% | 187,980 | 23.9% |
[ 7.0% - 7.5% ] 7.13% | 5,357 | 14.0% |
[ 7.0% - 7.5% ] 7.31% | 33,837 | 23.9% |
[ 7.0% - 7.5% ] 7.44% | 141,911 | 20.3% |
[ 7.5% - 8.0% ] 7.62% | 113,192 | 13.2% |
[ 7.5% - 8.0% ] 7.82% | 85,577 | 17.4% |
[ 7.5% - 8.0% ] 8.00% | 51,040 | 17.6% |
[ 8.0% - 8.5% ] 8.20% | 56,022 | 22.4% |
[ 8.0% - 8.5% ] 8.34% | 83,316 | 36.5% |
[ 8.0% - 8.5% ] 8.48% | 118,174 | 21.0% |
[ 8.5% - 9.0% ] 8.73% | 37,749 | 27.7% |
[ 8.5% - 9.0% ] 8.88% | 160,877 | 15.0% |
[ 9.0% - 9.5% ] 9.06% | 73,971 | 17.4% |
[ 9.0% - 9.5% ] 9.25% | 57,184 | 22.8% |
[ 9.0% - 9.5% ] 9.41% | 139,811 | 17.1% |
[ 9.5% - 10.0% ] 9.61% | 50,885 | 12.0% |
[ 9.5% - 10.0% ] 9.93% | 23,371 | 20.3% |
[ 10.5% - 11.0% ] 10.73% | 2,219 | 13.4% |
[ 10.5% - 11.0% ] 10.75% | 35,488 | 22.1% |
[ 11.0% - 11.5% ] 11.10% | 10,682 | 5.2% |
[ 11.5% - 12.0% ] 11.57% | 9,781 | 8.3% |
[ 11.5% - 12.0% ] 11.82% | 9,574 | 7.8% |
[ 12.0% - 12.5% ] 12.03% | 104,713 | 27.2% |
[ 12.5% - 13.0% ] 12.69% | 69,225 | 29.6% |
[ 12.5% - 13.0% ] 12.77% | 47,677 | 24.8% |
[ 13.0% - 13.5% ] 13.37% | 32,247 | 13.6% |
[ 14.0% - 14.5% ] 14.44% | 2,348 | 3.6% |
[ 15.5% - 16.0% ] 15.99% | 3,914 | 25.1% |
[ 18.5% - 19.0% ] 18.59% | 468 | 20.9% |
[ 22.0% - 22.5% ] 22.18% | 2,849 | 21.0% |
[ 33.0% - 33.5% ] 33.47% | 487 | 9.2% |