Immigrants from Western Africa 4 or more Vehicles in Household
COMPARE
Immigrants from Western Africa
Select to Compare
4 or more Vehicles in Household
Immigrants from Western Africa 4 or more Vehicles in Household
5.4%
4+ VEHICLES AVAILABLE
0.3/ 100
METRIC RATING
281st/ 347
METRIC RANK
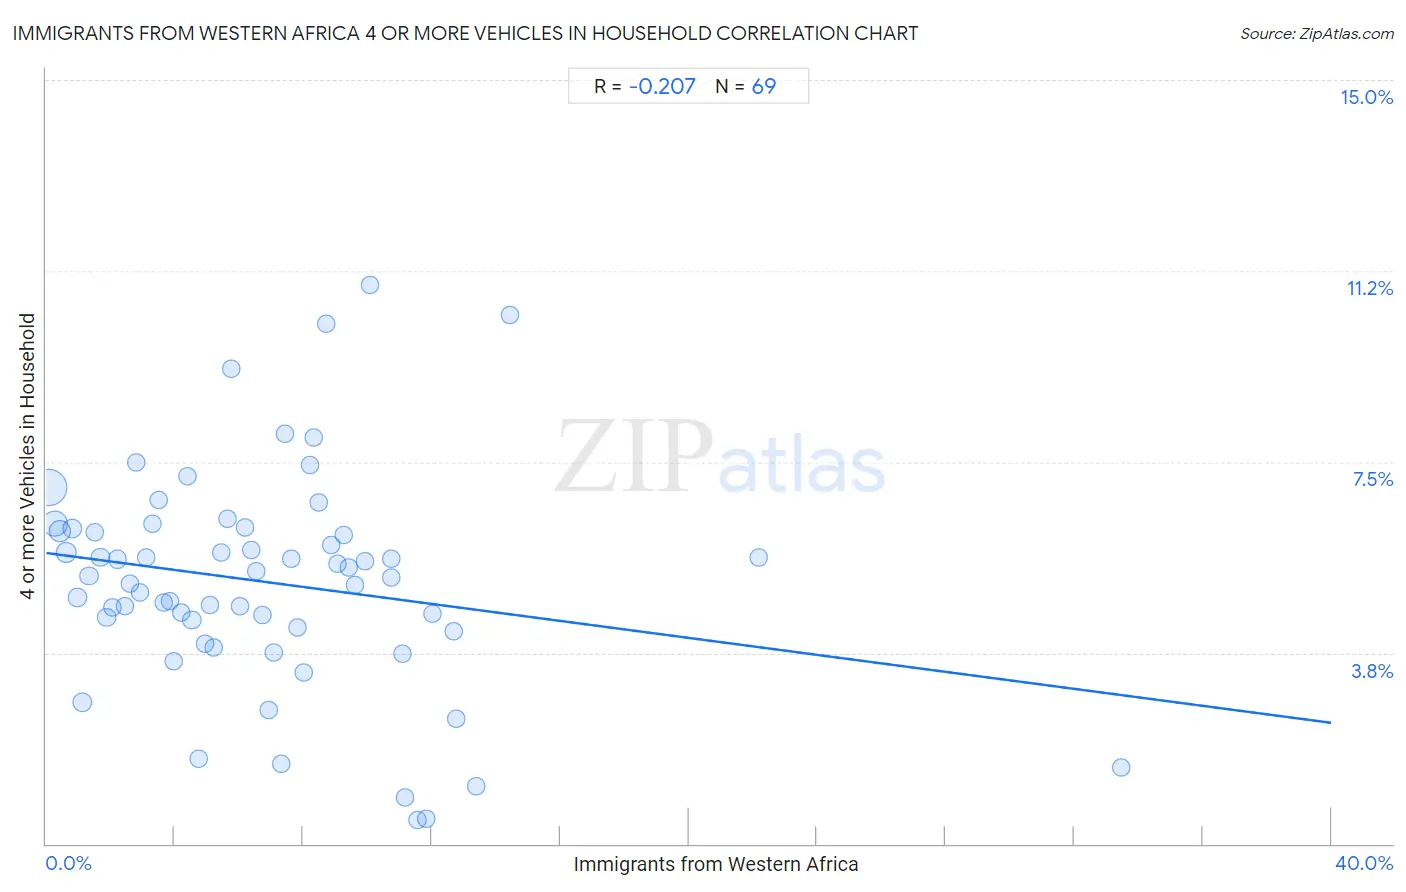
Immigrants from Western Africa 4 or more Vehicles in Household Correlation Chart
The statistical analysis conducted on geographies consisting of 355,941,999 people shows a weak negative correlation between the proportion of Immigrants from Western Africa and percentage of households with 4 or more vehicles available in the United States with a correlation coefficient (R) of -0.207 and weighted average of 5.4%. On average, for every 1% (one percent) increase in Immigrants from Western Africa within a typical geography, there is a decrease of 0.083% in percentage of households with 4 or more vehicles available.
It is essential to understand that the correlation between the percentage of Immigrants from Western Africa and percentage of households with 4 or more vehicles available does not imply a direct cause-and-effect relationship. It remains uncertain whether the presence of Immigrants from Western Africa influences an upward or downward trend in the level of percentage of households with 4 or more vehicles available within an area, or if Immigrants from Western Africa simply ended up residing in those areas with higher or lower levels of percentage of households with 4 or more vehicles available due to other factors.
Demographics Similar to Immigrants from Western Africa by 4 or more Vehicles in Household
In terms of 4 or more vehicles in household, the demographic groups most similar to Immigrants from Western Africa are Alsatian (5.4%, a difference of 0.070%), Immigrants from Uruguay (5.4%, a difference of 0.080%), Immigrants from Spain (5.4%, a difference of 0.17%), Immigrants from Ireland (5.4%, a difference of 0.25%), and Immigrants from Eastern Europe (5.4%, a difference of 0.54%).
| Demographics | Rating | Rank | 4 or more Vehicles in Household |
| Blacks/African Americans | 0.6 /100 | #274 | Tragic 5.5% |
| Cambodians | 0.5 /100 | #275 | Tragic 5.5% |
| Immigrants from Latvia | 0.5 /100 | #276 | Tragic 5.5% |
| Immigrants from Bulgaria | 0.5 /100 | #277 | Tragic 5.5% |
| Immigrants from Eastern Europe | 0.4 /100 | #278 | Tragic 5.4% |
| Immigrants from Uruguay | 0.3 /100 | #279 | Tragic 5.4% |
| Alsatians | 0.3 /100 | #280 | Tragic 5.4% |
| Immigrants from Western Africa | 0.3 /100 | #281 | Tragic 5.4% |
| Immigrants from Spain | 0.3 /100 | #282 | Tragic 5.4% |
| Immigrants from Ireland | 0.3 /100 | #283 | Tragic 5.4% |
| Brazilians | 0.3 /100 | #284 | Tragic 5.4% |
| Immigrants from Liberia | 0.2 /100 | #285 | Tragic 5.4% |
| Immigrants from Colombia | 0.2 /100 | #286 | Tragic 5.4% |
| Immigrants from Croatia | 0.2 /100 | #287 | Tragic 5.4% |
| Venezuelans | 0.2 /100 | #288 | Tragic 5.3% |
Immigrants from Western Africa 4 or more Vehicles in Household Correlation Summary
| Measurement | Immigrants from Western Africa Data | 4 or more Vehicles in Household Data |
| Minimum | 0.083% | 0.47% |
| Maximum | 33.5% | 11.0% |
| Range | 33.4% | 10.5% |
| Mean | 6.8% | 5.1% |
| Median | 6.2% | 5.3% |
| Interquartile 25% (IQ1) | 3.0% | 4.2% |
| Interquartile 75% (IQ3) | 9.3% | 6.2% |
| Interquartile Range (IQR) | 6.3% | 2.0% |
| Standard Deviation (Sample) | 5.3% | 2.1% |
| Standard Deviation (Population) | 5.3% | 2.1% |
Correlation Details
| Immigrants from Western Africa Percentile | Sample Size | 4 or more Vehicles in Household |
[ 0.0% - 0.5% ] 0.083% | 161,843,800 | 7.0% |
[ 0.0% - 0.5% ] 0.26% | 67,092,901 | 6.3% |
[ 0.0% - 0.5% ] 0.43% | 34,502,708 | 6.1% |
[ 0.5% - 1.0% ] 0.62% | 22,427,249 | 5.7% |
[ 0.5% - 1.0% ] 0.80% | 14,177,590 | 6.2% |
[ 0.5% - 1.0% ] 0.99% | 11,459,768 | 4.8% |
[ 1.0% - 1.5% ] 1.11% | 14,109,242 | 2.8% |
[ 1.0% - 1.5% ] 1.33% | 5,587,162 | 5.3% |
[ 1.5% - 2.0% ] 1.51% | 3,595,356 | 6.1% |
[ 1.5% - 2.0% ] 1.69% | 3,575,279 | 5.6% |
[ 1.5% - 2.0% ] 1.88% | 2,673,089 | 4.4% |
[ 2.0% - 2.5% ] 2.05% | 1,643,351 | 4.6% |
[ 2.0% - 2.5% ] 2.23% | 1,728,267 | 5.6% |
[ 2.0% - 2.5% ] 2.44% | 968,488 | 4.7% |
[ 2.5% - 3.0% ] 2.61% | 1,623,822 | 5.1% |
[ 2.5% - 3.0% ] 2.79% | 608,609 | 7.5% |
[ 2.5% - 3.0% ] 2.92% | 624,830 | 4.9% |
[ 3.0% - 3.5% ] 3.12% | 517,667 | 5.6% |
[ 3.0% - 3.5% ] 3.32% | 444,429 | 6.3% |
[ 3.0% - 3.5% ] 3.49% | 427,455 | 6.8% |
[ 3.5% - 4.0% ] 3.67% | 496,830 | 4.7% |
[ 3.5% - 4.0% ] 3.85% | 642,354 | 4.8% |
[ 3.5% - 4.0% ] 3.98% | 200,707 | 3.6% |
[ 4.0% - 4.5% ] 4.21% | 438,956 | 4.5% |
[ 4.0% - 4.5% ] 4.38% | 340,406 | 7.2% |
[ 4.5% - 5.0% ] 4.53% | 673,498 | 4.4% |
[ 4.5% - 5.0% ] 4.74% | 142,902 | 1.7% |
[ 4.5% - 5.0% ] 4.95% | 115,169 | 3.9% |
[ 5.0% - 5.5% ] 5.09% | 105,662 | 4.7% |
[ 5.0% - 5.5% ] 5.23% | 169,206 | 3.9% |
[ 5.0% - 5.5% ] 5.47% | 124,366 | 5.7% |
[ 5.5% - 6.0% ] 5.63% | 176,855 | 6.4% |
[ 5.5% - 6.0% ] 5.77% | 87,870 | 9.3% |
[ 6.0% - 6.5% ] 6.02% | 330,250 | 4.7% |
[ 6.0% - 6.5% ] 6.17% | 72,617 | 6.2% |
[ 6.0% - 6.5% ] 6.38% | 111,574 | 5.8% |
[ 6.5% - 7.0% ] 6.54% | 178,929 | 5.3% |
[ 6.5% - 7.0% ] 6.72% | 149,046 | 4.5% |
[ 6.5% - 7.0% ] 6.91% | 187,980 | 2.6% |
[ 7.0% - 7.5% ] 7.09% | 1,735 | 3.7% |
[ 7.0% - 7.5% ] 7.31% | 33,837 | 1.6% |
[ 7.0% - 7.5% ] 7.43% | 146,673 | 8.0% |
[ 7.5% - 8.0% ] 7.62% | 113,192 | 5.6% |
[ 7.5% - 8.0% ] 7.82% | 85,577 | 4.2% |
[ 7.5% - 8.0% ] 8.00% | 51,040 | 3.4% |
[ 8.0% - 8.5% ] 8.20% | 56,022 | 7.4% |
[ 8.0% - 8.5% ] 8.34% | 83,316 | 8.0% |
[ 8.0% - 8.5% ] 8.48% | 118,174 | 6.7% |
[ 8.5% - 9.0% ] 8.73% | 37,749 | 10.2% |
[ 8.5% - 9.0% ] 8.88% | 160,368 | 5.9% |
[ 9.0% - 9.5% ] 9.06% | 73,971 | 5.5% |
[ 9.0% - 9.5% ] 9.25% | 57,718 | 6.1% |
[ 9.0% - 9.5% ] 9.41% | 139,811 | 5.4% |
[ 9.5% - 10.0% ] 9.61% | 50,885 | 5.1% |
[ 9.5% - 10.0% ] 9.93% | 23,371 | 5.6% |
[ 10.0% - 10.5% ] 10.08% | 1,875 | 11.0% |
[ 10.5% - 11.0% ] 10.73% | 2,219 | 5.6% |
[ 10.5% - 11.0% ] 10.75% | 35,488 | 5.2% |
[ 11.0% - 11.5% ] 11.10% | 10,682 | 3.7% |
[ 11.0% - 11.5% ] 11.15% | 3,156 | 0.92% |
[ 11.5% - 12.0% ] 11.57% | 9,781 | 0.47% |
[ 11.5% - 12.0% ] 11.82% | 9,574 | 0.48% |
[ 12.0% - 12.5% ] 12.03% | 104,713 | 4.5% |
[ 12.5% - 13.0% ] 12.69% | 69,225 | 4.2% |
[ 12.5% - 13.0% ] 12.77% | 47,677 | 2.5% |
[ 13.0% - 13.5% ] 13.37% | 32,247 | 1.1% |
[ 14.0% - 14.5% ] 14.44% | 2,348 | 10.4% |
[ 22.0% - 22.5% ] 22.18% | 2,849 | 5.6% |
[ 33.0% - 33.5% ] 33.47% | 487 | 1.5% |