Immigrants from Western Africa vs Immigrants from Mexico Married-Couple Family Poverty
COMPARE
Immigrants from Western Africa
Immigrants from Mexico
Married-Couple Family Poverty
Married-Couple Family Poverty Comparison
Immigrants from Western Africa
Immigrants from Mexico
5.8%
MARRIED-COUPLE FAMILY POVERTY
2.4/ 100
METRIC RATING
242nd/ 347
METRIC RANK
7.6%
MARRIED-COUPLE FAMILY POVERTY
0.0/ 100
METRIC RATING
328th/ 347
METRIC RANK
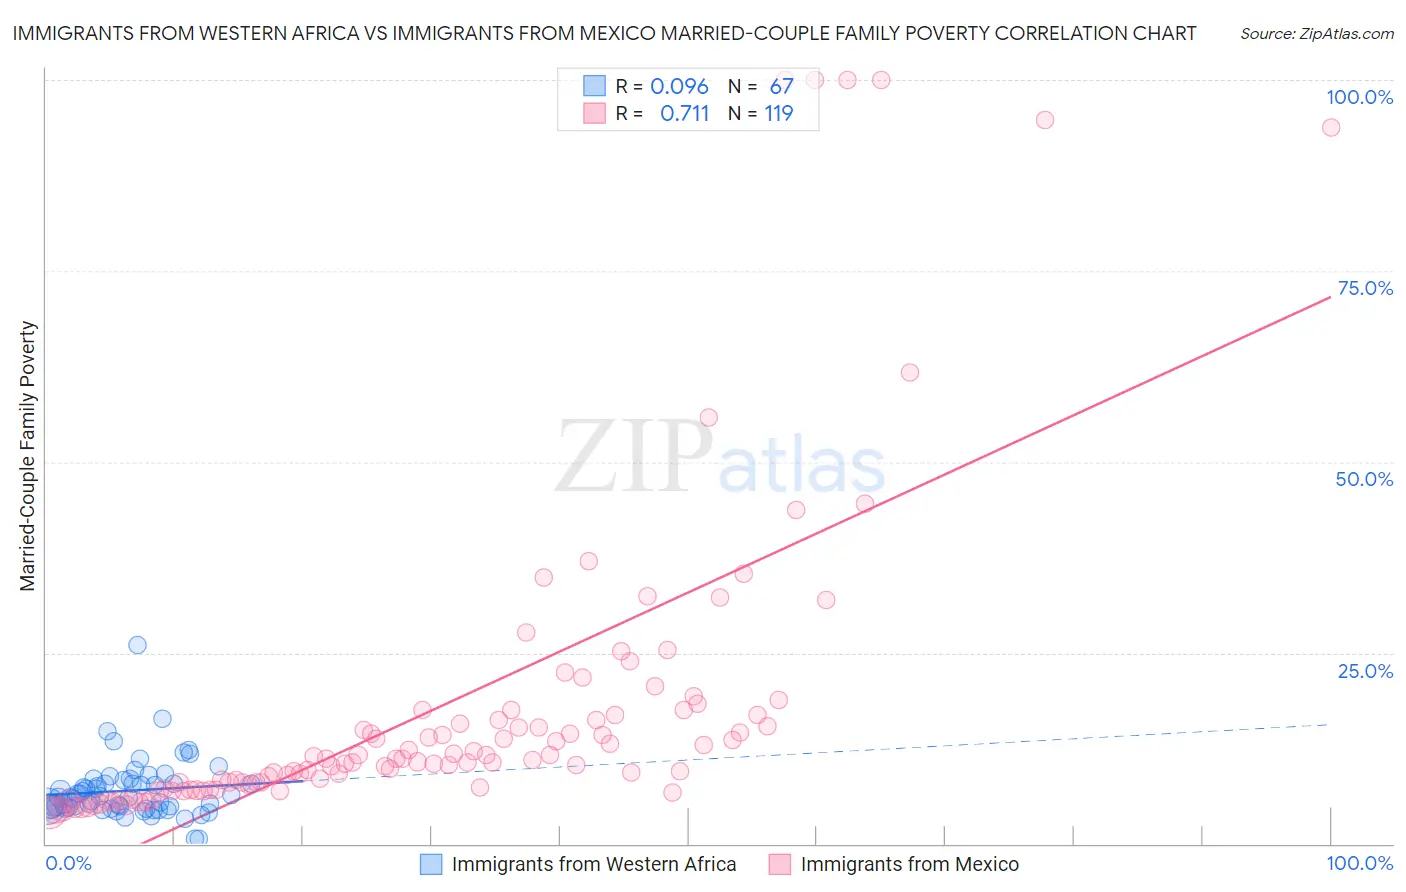
Immigrants from Western Africa vs Immigrants from Mexico Married-Couple Family Poverty Correlation Chart
The statistical analysis conducted on geographies consisting of 355,238,602 people shows a slight positive correlation between the proportion of Immigrants from Western Africa and poverty level among married-couple families in the United States with a correlation coefficient (R) of 0.096 and weighted average of 5.8%. Similarly, the statistical analysis conducted on geographies consisting of 506,470,232 people shows a strong positive correlation between the proportion of Immigrants from Mexico and poverty level among married-couple families in the United States with a correlation coefficient (R) of 0.711 and weighted average of 7.6%, a difference of 31.1%.
Married-Couple Family Poverty Correlation Summary
| Measurement | Immigrants from Western Africa | Immigrants from Mexico |
| Minimum | 0.65% | 4.1% |
| Maximum | 26.1% | 100.0% |
| Range | 25.5% | 95.9% |
| Mean | 6.9% | 18.1% |
| Median | 6.1% | 11.1% |
| Interquartile 25% (IQ1) | 4.7% | 7.8% |
| Interquartile 75% (IQ3) | 7.9% | 16.8% |
| Interquartile Range (IQR) | 3.2% | 9.1% |
| Standard Deviation (Sample) | 3.8% | 21.0% |
| Standard Deviation (Population) | 3.8% | 21.0% |
Similar Demographics by Married-Couple Family Poverty
Demographics Similar to Immigrants from Western Africa by Married-Couple Family Poverty
In terms of married-couple family poverty, the demographic groups most similar to Immigrants from Western Africa are Immigrants from Panama (5.8%, a difference of 0.090%), Fijian (5.8%, a difference of 0.11%), Somali (5.8%, a difference of 0.16%), Chickasaw (5.8%, a difference of 0.17%), and Venezuelan (5.8%, a difference of 0.28%).
| Demographics | Rating | Rank | Married-Couple Family Poverty |
| Immigrants | Sudan | 3.5 /100 | #235 | Tragic 5.7% |
| Ghanaians | 3.3 /100 | #236 | Tragic 5.7% |
| Immigrants | South America | 3.1 /100 | #237 | Tragic 5.7% |
| Cherokee | 2.7 /100 | #238 | Tragic 5.8% |
| Venezuelans | 2.7 /100 | #239 | Tragic 5.8% |
| Fijians | 2.5 /100 | #240 | Tragic 5.8% |
| Immigrants | Panama | 2.5 /100 | #241 | Tragic 5.8% |
| Immigrants | Western Africa | 2.4 /100 | #242 | Tragic 5.8% |
| Somalis | 2.3 /100 | #243 | Tragic 5.8% |
| Chickasaw | 2.3 /100 | #244 | Tragic 5.8% |
| Immigrants | Afghanistan | 2.1 /100 | #245 | Tragic 5.8% |
| Immigrants | Venezuela | 1.8 /100 | #246 | Tragic 5.8% |
| Iraqis | 1.4 /100 | #247 | Tragic 5.9% |
| Cree | 1.2 /100 | #248 | Tragic 5.9% |
| Tsimshian | 1.1 /100 | #249 | Tragic 5.9% |
Demographics Similar to Immigrants from Mexico by Married-Couple Family Poverty
In terms of married-couple family poverty, the demographic groups most similar to Immigrants from Mexico are Immigrants from Bangladesh (7.5%, a difference of 1.2%), Hispanic or Latino (7.5%, a difference of 1.2%), Immigrants from Cuba (7.5%, a difference of 1.4%), Immigrants from Central America (7.4%, a difference of 2.0%), and Vietnamese (7.4%, a difference of 2.1%).
| Demographics | Rating | Rank | Married-Couple Family Poverty |
| Immigrants | Caribbean | 0.0 /100 | #321 | Tragic 7.3% |
| Immigrants | Honduras | 0.0 /100 | #322 | Tragic 7.3% |
| Vietnamese | 0.0 /100 | #323 | Tragic 7.4% |
| Immigrants | Central America | 0.0 /100 | #324 | Tragic 7.4% |
| Immigrants | Cuba | 0.0 /100 | #325 | Tragic 7.5% |
| Immigrants | Bangladesh | 0.0 /100 | #326 | Tragic 7.5% |
| Hispanics or Latinos | 0.0 /100 | #327 | Tragic 7.5% |
| Immigrants | Mexico | 0.0 /100 | #328 | Tragic 7.6% |
| Natives/Alaskans | 0.0 /100 | #329 | Tragic 8.2% |
| Paiute | 0.0 /100 | #330 | Tragic 8.3% |
| Central American Indians | 0.0 /100 | #331 | Tragic 8.3% |
| Dominicans | 0.0 /100 | #332 | Tragic 8.3% |
| Lumbee | 0.0 /100 | #333 | Tragic 8.3% |
| Immigrants | Dominican Republic | 0.0 /100 | #334 | Tragic 8.4% |
| Sioux | 0.0 /100 | #335 | Tragic 8.7% |