Immigrants from Turkey vs Salvadoran Married-Couple Family Poverty
COMPARE
Immigrants from Turkey
Salvadoran
Married-Couple Family Poverty
Married-Couple Family Poverty Comparison
Immigrants from Turkey
Salvadorans
4.6%
MARRIED-COUPLE FAMILY POVERTY
98.6/ 100
METRIC RATING
86th/ 347
METRIC RANK
6.5%
MARRIED-COUPLE FAMILY POVERTY
0.0/ 100
METRIC RATING
288th/ 347
METRIC RANK
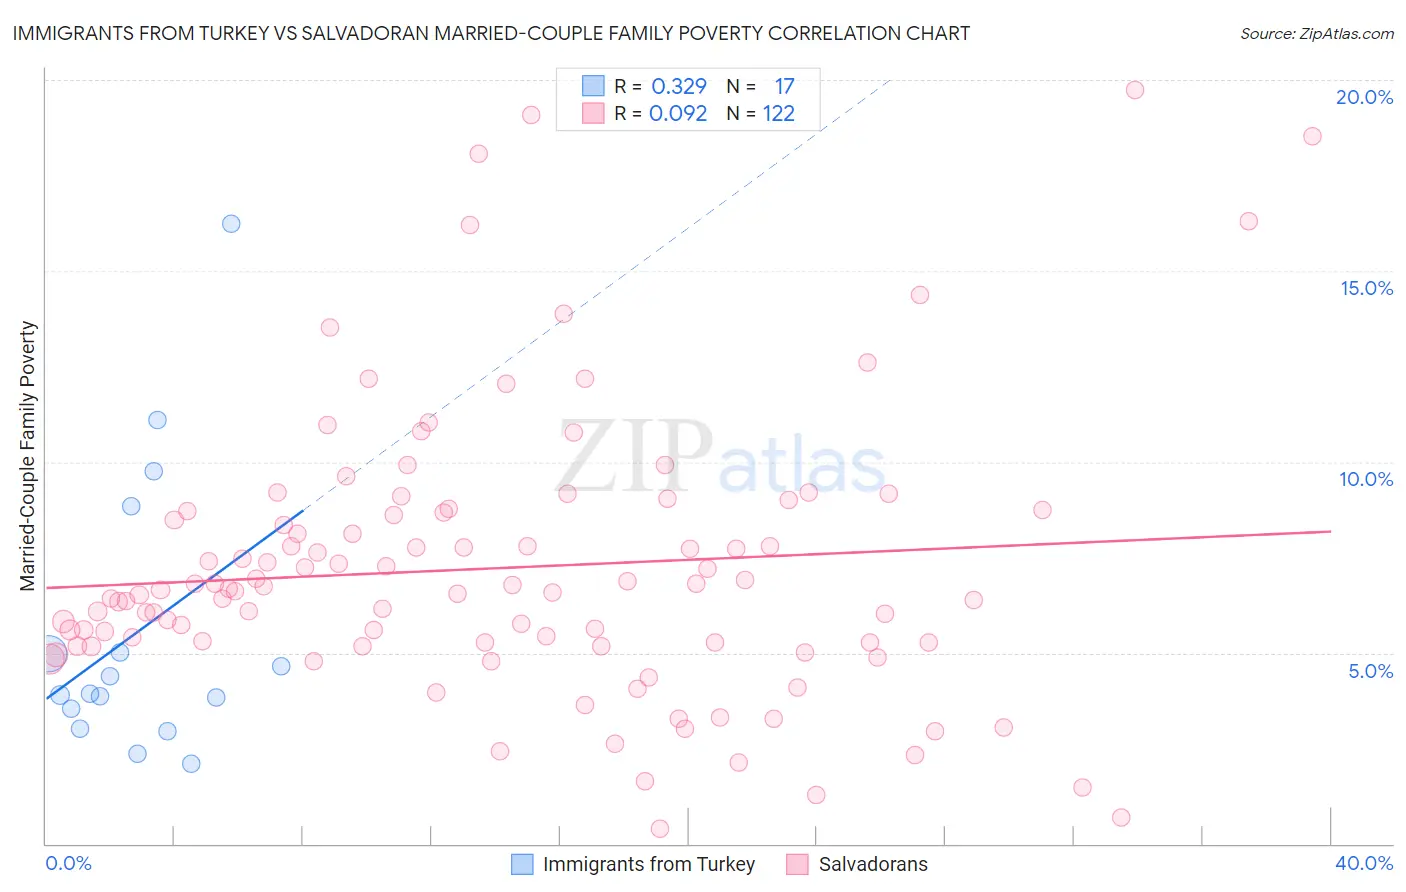
Immigrants from Turkey vs Salvadoran Married-Couple Family Poverty Correlation Chart
The statistical analysis conducted on geographies consisting of 221,764,079 people shows a mild positive correlation between the proportion of Immigrants from Turkey and poverty level among married-couple families in the United States with a correlation coefficient (R) of 0.329 and weighted average of 4.6%. Similarly, the statistical analysis conducted on geographies consisting of 395,885,602 people shows a slight positive correlation between the proportion of Salvadorans and poverty level among married-couple families in the United States with a correlation coefficient (R) of 0.092 and weighted average of 6.5%, a difference of 42.7%.
Married-Couple Family Poverty Correlation Summary
| Measurement | Immigrants from Turkey | Salvadoran |
| Minimum | 2.1% | 0.40% |
| Maximum | 16.2% | 19.7% |
| Range | 14.1% | 19.3% |
| Mean | 5.6% | 7.2% |
| Median | 3.9% | 6.6% |
| Interquartile 25% (IQ1) | 3.3% | 5.3% |
| Interquartile 75% (IQ3) | 6.9% | 8.7% |
| Interquartile Range (IQR) | 3.7% | 3.4% |
| Standard Deviation (Sample) | 3.8% | 3.6% |
| Standard Deviation (Population) | 3.7% | 3.6% |
Similar Demographics by Married-Couple Family Poverty
Demographics Similar to Immigrants from Turkey by Married-Couple Family Poverty
In terms of married-couple family poverty, the demographic groups most similar to Immigrants from Turkey are South African (4.6%, a difference of 0.040%), Immigrants from North Macedonia (4.6%, a difference of 0.080%), Bolivian (4.6%, a difference of 0.18%), Immigrants from Croatia (4.6%, a difference of 0.27%), and Immigrants from Czechoslovakia (4.6%, a difference of 0.29%).
| Demographics | Rating | Rank | Married-Couple Family Poverty |
| Immigrants | Iran | 99.0 /100 | #79 | Exceptional 4.5% |
| Icelanders | 99.0 /100 | #80 | Exceptional 4.5% |
| Immigrants | Greece | 98.9 /100 | #81 | Exceptional 4.5% |
| Canadians | 98.8 /100 | #82 | Exceptional 4.5% |
| Immigrants | Denmark | 98.8 /100 | #83 | Exceptional 4.6% |
| Immigrants | Croatia | 98.7 /100 | #84 | Exceptional 4.6% |
| South Africans | 98.7 /100 | #85 | Exceptional 4.6% |
| Immigrants | Turkey | 98.6 /100 | #86 | Exceptional 4.6% |
| Immigrants | North Macedonia | 98.6 /100 | #87 | Exceptional 4.6% |
| Bolivians | 98.6 /100 | #88 | Exceptional 4.6% |
| Immigrants | Czechoslovakia | 98.5 /100 | #89 | Exceptional 4.6% |
| Immigrants | Switzerland | 98.5 /100 | #90 | Exceptional 4.6% |
| Basques | 98.5 /100 | #91 | Exceptional 4.6% |
| Immigrants | Norway | 98.4 /100 | #92 | Exceptional 4.6% |
| Koreans | 98.3 /100 | #93 | Exceptional 4.6% |
Demographics Similar to Salvadorans by Married-Couple Family Poverty
In terms of married-couple family poverty, the demographic groups most similar to Salvadorans are Nepalese (6.5%, a difference of 0.17%), Ecuadorian (6.5%, a difference of 0.19%), Immigrants from Barbados (6.5%, a difference of 0.40%), Belizean (6.5%, a difference of 0.44%), and Guyanese (6.5%, a difference of 0.56%).
| Demographics | Rating | Rank | Married-Couple Family Poverty |
| Mexican American Indians | 0.0 /100 | #281 | Tragic 6.4% |
| Seminole | 0.0 /100 | #282 | Tragic 6.4% |
| Ute | 0.0 /100 | #283 | Tragic 6.4% |
| Dutch West Indians | 0.0 /100 | #284 | Tragic 6.4% |
| Blacks/African Americans | 0.0 /100 | #285 | Tragic 6.5% |
| Guyanese | 0.0 /100 | #286 | Tragic 6.5% |
| Ecuadorians | 0.0 /100 | #287 | Tragic 6.5% |
| Salvadorans | 0.0 /100 | #288 | Tragic 6.5% |
| Nepalese | 0.0 /100 | #289 | Tragic 6.5% |
| Immigrants | Barbados | 0.0 /100 | #290 | Tragic 6.5% |
| Belizeans | 0.0 /100 | #291 | Tragic 6.5% |
| Immigrants | Lebanon | 0.0 /100 | #292 | Tragic 6.6% |
| Arapaho | 0.0 /100 | #293 | Tragic 6.6% |
| Bahamians | 0.0 /100 | #294 | Tragic 6.6% |
| Immigrants | Uzbekistan | 0.0 /100 | #295 | Tragic 6.6% |