Immigrants from Turkey Married-couple Households
COMPARE
Immigrants from Turkey
Select to Compare
Married-couple Households
Immigrants from Turkey Married-couple Households
46.8%
MARRIED-COUPLE HOUSEHOLDS
70.2/ 100
METRIC RATING
163rd/ 347
METRIC RANK
Immigrants from Turkey Married-couple Households Correlation Chart
The statistical analysis conducted on geographies consisting of 222,970,695 people shows a mild positive correlation between the proportion of Immigrants from Turkey and percentage of married-couple family households in the United States with a correlation coefficient (R) of 0.341 and weighted average of 46.8%. On average, for every 1% (one percent) increase in Immigrants from Turkey within a typical geography, there is an increase of 0.93% in percentage of married-couple family households.
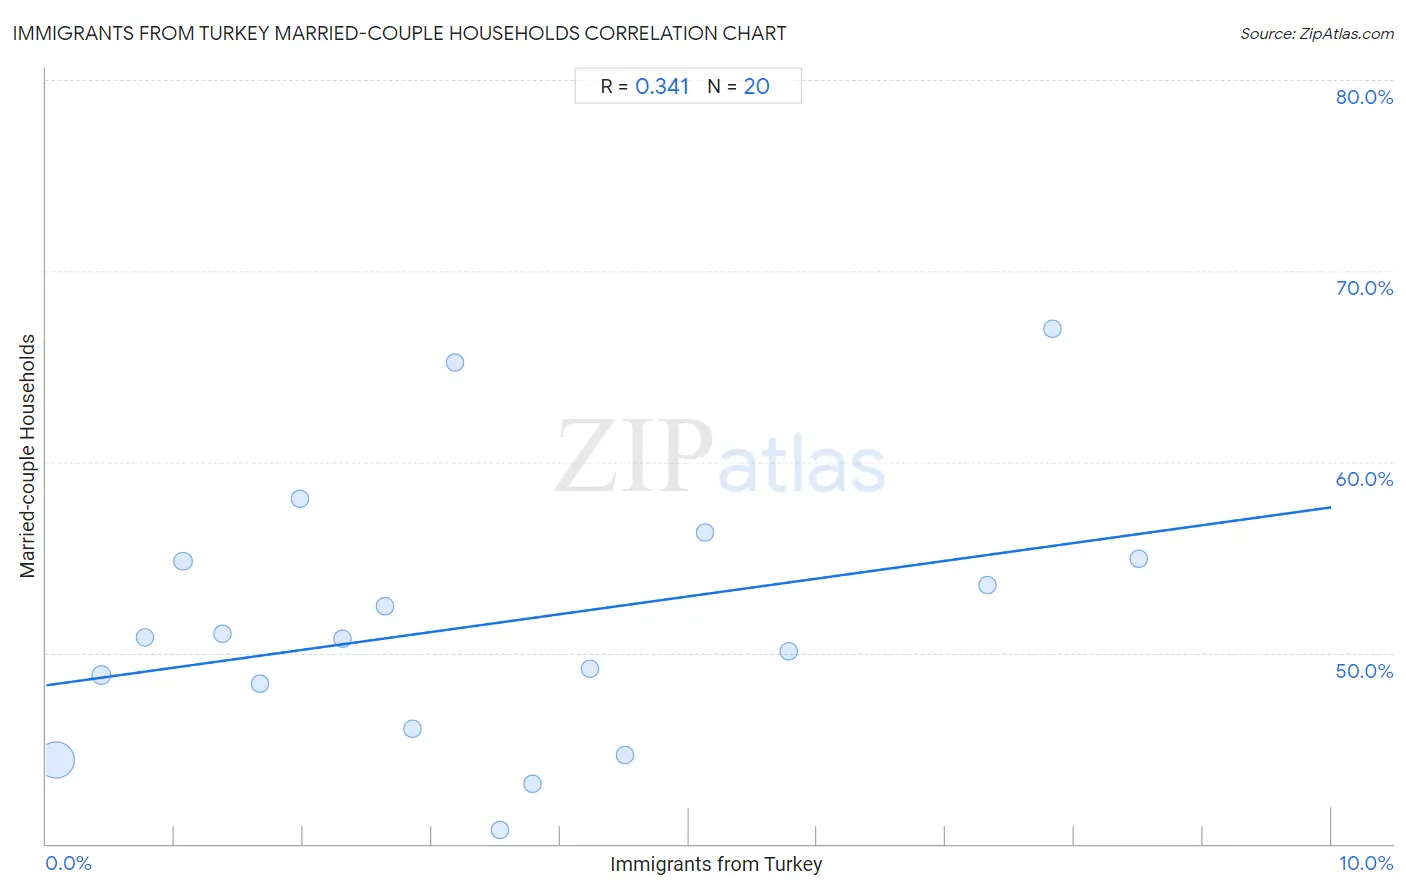
It is essential to understand that the correlation between the percentage of Immigrants from Turkey and percentage of married-couple family households does not imply a direct cause-and-effect relationship. It remains uncertain whether the presence of Immigrants from Turkey influences an upward or downward trend in the level of percentage of married-couple family households within an area, or if Immigrants from Turkey simply ended up residing in those areas with higher or lower levels of percentage of married-couple family households due to other factors.
Demographics Similar to Immigrants from Turkey by Married-couple Households
In terms of married-couple households, the demographic groups most similar to Immigrants from Turkey are Immigrants from Kazakhstan (46.8%, a difference of 0.010%), Immigrants from Southern Europe (46.8%, a difference of 0.010%), Delaware (46.8%, a difference of 0.040%), Colombian (46.8%, a difference of 0.040%), and Iraqi (46.9%, a difference of 0.070%).
| Demographics | Rating | Rank | Married-couple Households |
| Armenians | 75.4 /100 | #156 | Good 46.9% |
| Immigrants from Oceania | 74.8 /100 | #157 | Good 46.9% |
| Nonimmigrants | 73.3 /100 | #158 | Good 46.9% |
| Osage | 73.2 /100 | #159 | Good 46.9% |
| Iraqis | 71.7 /100 | #160 | Good 46.9% |
| Delaware | 71.2 /100 | #161 | Good 46.8% |
| Colombians | 71.0 /100 | #162 | Good 46.8% |
| Immigrants from Turkey | 70.2 /100 | #163 | Good 46.8% |
| Immigrants from Kazakhstan | 70.0 /100 | #164 | Good 46.8% |
| Immigrants from Southern Europe | 69.9 /100 | #165 | Good 46.8% |
| Cherokee | 65.7 /100 | #166 | Good 46.7% |
| Immigrants from Croatia | 64.2 /100 | #167 | Good 46.7% |
| Israelis | 62.3 /100 | #168 | Good 46.7% |
| Spanish American Indians | 59.4 /100 | #169 | Average 46.6% |
| South Americans | 58.0 /100 | #170 | Average 46.6% |
Immigrants from Turkey Married-couple Households Correlation Summary
| Measurement | Immigrants from Turkey Data | Married-couple Households Data |
| Minimum | 0.075% | 40.7% |
| Maximum | 8.5% | 67.0% |
| Range | 8.4% | 26.2% |
| Mean | 3.4% | 51.5% |
| Median | 3.0% | 50.8% |
| Interquartile 25% (IQ1) | 1.5% | 47.2% |
| Interquartile 75% (IQ3) | 4.8% | 54.9% |
| Interquartile Range (IQR) | 3.3% | 7.7% |
| Standard Deviation (Sample) | 2.5% | 6.7% |
| Standard Deviation (Population) | 2.4% | 6.6% |
Correlation Details
| Immigrants from Turkey Percentile | Sample Size | Married-couple Households |
[ 0.0% - 0.5% ] 0.075% | 205,766,495 | 44.4% |
[ 0.0% - 0.5% ] 0.42% | 12,827,267 | 48.9% |
[ 0.5% - 1.0% ] 0.77% | 2,362,784 | 50.8% |
[ 1.0% - 1.5% ] 1.06% | 866,402 | 54.8% |
[ 1.0% - 1.5% ] 1.37% | 307,803 | 51.0% |
[ 1.5% - 2.0% ] 1.67% | 336,176 | 48.4% |
[ 1.5% - 2.0% ] 1.98% | 297,844 | 58.1% |
[ 2.0% - 2.5% ] 2.31% | 63,506 | 50.7% |
[ 2.5% - 3.0% ] 2.63% | 44,835 | 52.4% |
[ 2.5% - 3.0% ] 2.85% | 32,612 | 46.0% |
[ 3.0% - 3.5% ] 3.18% | 7,619 | 65.2% |
[ 3.5% - 4.0% ] 3.53% | 11,204 | 40.7% |
[ 3.5% - 4.0% ] 3.78% | 17,240 | 43.1% |
[ 4.0% - 4.5% ] 4.23% | 2,740 | 49.2% |
[ 4.5% - 5.0% ] 4.51% | 2,440 | 44.7% |
[ 5.0% - 5.5% ] 5.12% | 5,798 | 56.3% |
[ 5.5% - 6.0% ] 5.78% | 11,458 | 50.1% |
[ 7.0% - 7.5% ] 7.32% | 5,476 | 53.5% |
[ 7.5% - 8.0% ] 7.83% | 702 | 67.0% |
[ 8.5% - 9.0% ] 8.50% | 294 | 55.0% |