Immigrants from Turkey GED/Equivalency

COMPARE

Immigrants from Turkey
Race
Ancestry
AfghanAfricanAlaska NativeAlaskan AthabascanAlbanianAleutAlsatianAmericanApacheArabArapahoArgentineanArmenianAssyrian/Chaldean/SyriacAustralianAustrianBahamianBangladeshiBarbadianBasqueBelgianBelizeanBermudanBhutaneseBlackfeetBolivianBrazilianBritishBritish West IndianBulgarianBurmeseCajunCambodianCanadianCape VerdeanCarpatho RusynCelticCentral AmericanCentral American IndianCherokeeCheyenneChickasawChileanChineseChippewaChoctawColombianColvilleComancheCosta RicanCreeCreekCroatianCrowCubanCypriotCzechCzechoslovakianDanishDelawareDominicanDutchDutch West IndianEastern EuropeanEcuadorianEgyptianEnglishEstonianEthiopianEuropeanFijianFilipinoFinnishFrenchFrench American IndianFrench CanadianGermanGerman RussianGhanaianGreekGuamanian/ChamorroGuatemalanGuyaneseHaitianHmongHonduranHopiHoumaHungarianIcelanderIndian (Asian)IndonesianInupiatIranianIraqiIrishIroquoisIsraeliItalianJamaicanJapaneseJordanianKenyanKiowaKoreanLaotianLatvianLebaneseLiberianLithuanianLumbeeLuxembourgerMacedonianMalaysianMalteseMarshalleseMenomineeMexicanMexican American IndianMongolianMoroccanNative HawaiianNavajoNepaleseNew ZealanderNicaraguanNigerianNorthern EuropeanNorwegianOkinawanOsageOttawaPaiutePakistaniPalestinianPanamanianParaguayanPennsylvania GermanPeruvianPimaPolishPortuguesePotawatomiPuebloPuerto RicanPuget Sound SalishRomanianRussianSalvadoranSamoanScandinavianScotch-IrishScottishSeminoleSenegaleseSerbianShoshoneSierra LeoneanSiouxSlavicSlovakSloveneSomaliSouth AfricanSouth AmericanSouth American IndianSoviet UnionSpaniardSpanishSpanish AmericanSpanish American IndianSri LankanSubsaharan AfricanSudaneseSwedishSwissSyrianTaiwaneseThaiTlingit-HaidaTohono O'OdhamTonganTrinidadian and TobagonianTsimshianTurkishU.S. Virgin IslanderUgandanUkrainianUruguayanUteVenezuelanVietnameseWelshWest IndianYakamaYaquiYugoslavianYumanYup'ikZimbabwean
Immigration
NonimmigrantsImmigrantsAfghanistanAfricaAlbaniaArgentinaArmeniaAsiaAustraliaAustriaBahamasBangladeshBarbadosBelarusBelgiumBelizeBoliviaBosnia and HerzegovinaBrazilBulgariaBurma/MyanmarCabo VerdeCambodiaCameroonCanadaCaribbeanCentral AmericaChileChinaColombiaCongoCosta RicaCroatiaCubaCzechoslovakiaDenmarkDominicaDominican RepublicEastern AfricaEastern AsiaEastern EuropeEcuadorEgyptEl SalvadorEnglandEritreaEthiopiaEuropeFijiFranceGermanyGhanaGreeceGrenadaGuatemalaGuyanaHaitiHondurasHong KongHungaryIndiaIndonesiaIranIraqIrelandIsraelItalyJamaicaJapanJordanKazakhstanKenyaKoreaKuwaitLaosLatin AmericaLatviaLebanonLiberiaLithuaniaMalaysiaMexicoMicronesiaMiddle AfricaMoldovaMoroccoNepalNetherlandsNicaraguaNigeriaNorth AmericaNorth MacedoniaNorthern AfricaNorthern EuropeNorwayOceaniaPakistanPanamaPeruPhilippinesPolandPortugalRomaniaRussiaSaudi ArabiaScotlandSenegalSerbiaSierra LeoneSingaporeSomaliaSouth AfricaSouth AmericaSouth Central AsiaSouth Eastern AsiaSouthern EuropeSpainSri LankaSt. Vincent and the GrenadinesSudanSwedenSwitzerlandSyriaTaiwanThailandTrinidad and TobagoTurkeyUgandaUkraineUruguayUzbekistanVenezuelaVietnamWest IndiesWestern AfricaWestern AsiaWestern EuropeYemenZaireZimbabweAzores
Select to Compare
Race
Ancestry
AfghanAfricanAlaska NativeAlaskan AthabascanAlbanianAleutAlsatianAmericanApacheArabArapahoArgentineanArmenianAssyrian/Chaldean/SyriacAustralianAustrianBahamianBangladeshiBarbadianBasqueBelgianBelizeanBermudanBhutaneseBlackfeetBolivianBrazilianBritishBritish West IndianBulgarianBurmeseCajunCambodianCanadianCape VerdeanCarpatho RusynCelticCentral AmericanCentral American IndianCherokeeCheyenneChickasawChileanChineseChippewaChoctawColombianColvilleComancheCosta RicanCreeCreekCroatianCrowCubanCypriotCzechCzechoslovakianDanishDelawareDominicanDutchDutch West IndianEastern EuropeanEcuadorianEgyptianEnglishEstonianEthiopianEuropeanFijianFilipinoFinnishFrenchFrench American IndianFrench CanadianGermanGerman RussianGhanaianGreekGuamanian/ChamorroGuatemalanGuyaneseHaitianHmongHonduranHopiHoumaHungarianIcelanderIndian (Asian)IndonesianInupiatIranianIraqiIrishIroquoisIsraeliItalianJamaicanJapaneseJordanianKenyanKiowaKoreanLaotianLatvianLebaneseLiberianLithuanianLumbeeLuxembourgerMacedonianMalaysianMalteseMarshalleseMenomineeMexicanMexican American IndianMongolianMoroccanNative HawaiianNavajoNepaleseNew ZealanderNicaraguanNigerianNorthern EuropeanNorwegianOkinawanOsageOttawaPaiutePakistaniPalestinianPanamanianParaguayanPennsylvania GermanPeruvianPimaPolishPortuguesePotawatomiPuebloPuerto RicanPuget Sound SalishRomanianRussianSalvadoranSamoanScandinavianScotch-IrishScottishSeminoleSenegaleseSerbianShoshoneSierra LeoneanSiouxSlavicSlovakSloveneSomaliSouth AfricanSouth AmericanSouth American IndianSoviet UnionSpaniardSpanishSpanish AmericanSpanish American IndianSri LankanSubsaharan AfricanSudaneseSwedishSwissSyrianTaiwaneseThaiTlingit-HaidaTohono O'OdhamTonganTrinidadian and TobagonianTsimshianTurkishU.S. Virgin IslanderUgandanUkrainianUruguayanUteVenezuelanVietnameseWelshWest IndianYakamaYaquiYugoslavianYumanYup'ikZimbabwean
Immigration
NonimmigrantsImmigrantsAfghanistanAfricaAlbaniaArgentinaArmeniaAsiaAustraliaAustriaBahamasBangladeshBarbadosBelarusBelgiumBelizeBoliviaBosnia and HerzegovinaBrazilBulgariaBurma/MyanmarCabo VerdeCambodiaCameroonCanadaCaribbeanCentral AmericaChileChinaColombiaCongoCosta RicaCroatiaCubaCzechoslovakiaDenmarkDominicaDominican RepublicEastern AfricaEastern AsiaEastern EuropeEcuadorEgyptEl SalvadorEnglandEritreaEthiopiaEuropeFijiFranceGermanyGhanaGreeceGrenadaGuatemalaGuyanaHaitiHondurasHong KongHungaryIndiaIndonesiaIranIraqIrelandIsraelItalyJamaicaJapanJordanKazakhstanKenyaKoreaKuwaitLaosLatin AmericaLatviaLebanonLiberiaLithuaniaMalaysiaMexicoMicronesiaMiddle AfricaMoldovaMoroccoNepalNetherlandsNicaraguaNigeriaNorth AmericaNorth MacedoniaNorthern AfricaNorthern EuropeNorwayOceaniaPakistanPanamaPeruPhilippinesPolandPortugalRomaniaRussiaSaudi ArabiaScotlandSenegalSerbiaSierra LeoneSingaporeSomaliaSouth AfricaSouth AmericaSouth Central AsiaSouth Eastern AsiaSouthern EuropeSpainSri LankaSt. Vincent and the GrenadinesSudanSwedenSwitzerlandSyriaTaiwanThailandTrinidad and TobagoUgandaUkraineUruguayUzbekistanVenezuelaVietnamWest IndiesWestern AfricaWestern AsiaWestern EuropeYemenZaireZimbabweAzores
GED/Equivalency
Income
Poverty
Unemployment
Labor Participation
Family Structure
Vehicle Availability
Education Level
Disability

Immigrants from Turkey GED/Equivalency
Exceptional

87.9%
GED/EQUIVALENCY
99.2/ 100
METRIC RATING
63rd/ 347
METRIC RANK

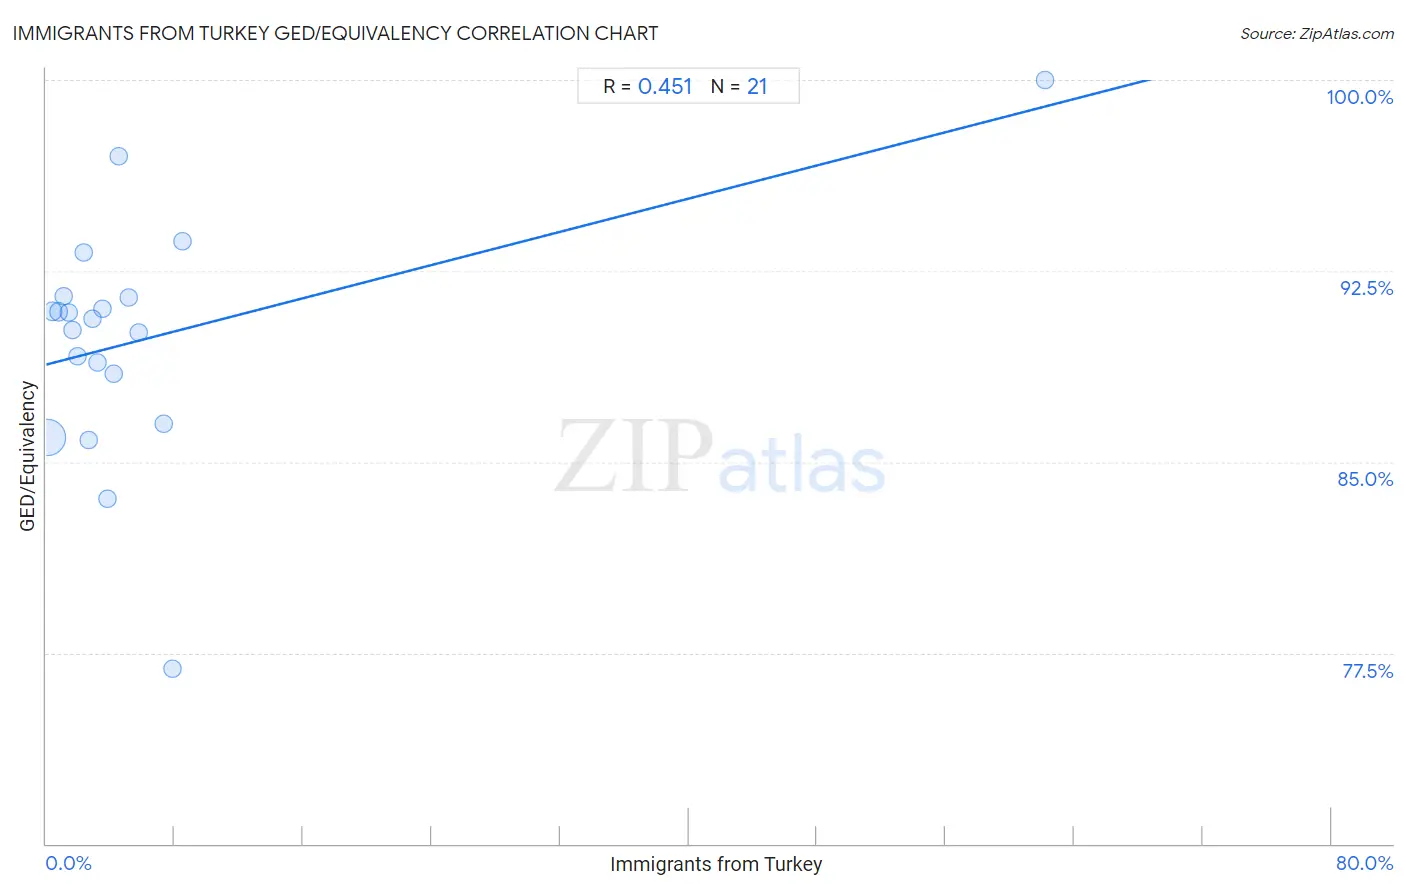
Immigrants from Turkey GED/Equivalency Correlation Chart

The statistical analysis conducted on geographies consisting of 223,057,775 people shows a moderate positive correlation between the proportion of Immigrants from Turkey and percentage of population with at least ged/equivalency education in the United States with a correlation coefficient (R) of 0.451 and weighted average of 87.9%. On average, for every 1% (one percent) increase in Immigrants from Turkey within a typical geography, there is an increase of 0.16% in percentage of population with at least ged/equivalency education.
Immigrants from Turkey GED/Equivalency
It is essential to understand that the correlation between the percentage of Immigrants from Turkey and percentage of population with at least ged/equivalency education does not imply a direct cause-and-effect relationship. It remains uncertain whether the presence of Immigrants from Turkey influences an upward or downward trend in the level of percentage of population with at least ged/equivalency education within an area, or if Immigrants from Turkey simply ended up residing in those areas with higher or lower levels of percentage of population with at least ged/equivalency education due to other factors.

Demographics Similar to Immigrants from Turkey by GED/Equivalency

In terms of ged/equivalency, the demographic groups most similar to Immigrants from Turkey are German (87.9%, a difference of 0.010%), Scandinavian (87.9%, a difference of 0.030%), European (87.9%, a difference of 0.030%), Serbian (87.9%, a difference of 0.040%), and Immigrants from Canada (87.9%, a difference of 0.040%).
DemographicsRating | RankGED/Equivalency
Immigrants from Denmark
99.4
/100
|
#56
Exceptional
88.0%
Immigrants from Czechoslovakia
99.3
/100
|
#57
Exceptional
87.9%
Northern Europeans
99.3
/100
|
#58
Exceptional
87.9%
Serbians
99.3
/100
|
#59
Exceptional
87.9%
Scandinavians
99.3
/100
|
#60
Exceptional
87.9%
Europeans
99.3
/100
|
#61
Exceptional
87.9%
Germans
99.3
/100
|
#62
Exceptional
87.9%
Immigrants from Turkey
99.2
/100
|
#63
Exceptional
87.9%
Immigrants from Canada
99.2
/100
|
#64
Exceptional
87.9%
Immigrants from North America
99.1
/100
|
#65
Exceptional
87.8%
Immigrants from Bulgaria
99.1
/100
|
#66
Exceptional
87.8%
British
99.1
/100
|
#67
Exceptional
87.8%
Immigrants from France
99.1
/100
|
#68
Exceptional
87.8%
Immigrants from Saudi Arabia
99.0
/100
|
#69
Exceptional
87.8%
Ukrainians
98.8
/100
|
#70
Exceptional
87.7%

Immigrants from Turkey GED/Equivalency Correlation Summary

MeasurementImmigrants from Turkey DataGED/Equivalency Data
Minimum0.075%76.9%
Maximum62.2%100.0%
Range62.1%23.1%
Mean6.2%89.8%
Median3.2%90.6%
Interquartile 25% (IQ1)1.5%87.5%
Interquartile 75% (IQ3)5.5%91.5%
Interquartile Range (IQR)3.9%4.0%
Standard Deviation (Sample)13.0%4.7%
Standard Deviation (Population)12.7%4.6%

Correlation Details

Immigrants from Turkey PercentileSample SizeGED/Equivalency
[
0.0%
-
0.5%
]
0.075%
205,825,92986.0%
[
0.0%
-
0.5%
]
0.42%
12,848,84490.9%
[
0.5%
-
1.0%
]
0.77%
2,367,48790.9%
[
1.0%
-
1.5%
]
1.06%
866,40291.5%
[
1.0%
-
1.5%
]
1.37%
308,57790.9%
[
1.5%
-
2.0%
]
1.67%
336,17690.2%
[
1.5%
-
2.0%
]
1.98%
297,84489.2%
[
2.0%
-
2.5%
]
2.31%
63,50693.2%
[
2.5%
-
3.0%
]
2.63%
45,39085.8%
[
2.5%
-
3.0%
]
2.85%
32,61290.6%
[
3.0%
-
3.5%
]
3.18%
7,61988.9%
[
3.5%
-
4.0%
]
3.53%
11,20491.0%
[
3.5%
-
4.0%
]
3.78%
17,24083.5%
[
4.0%
-
4.5%
]
4.23%
2,74088.5%
[
4.5%
-
5.0%
]
4.51%
2,44097.0%
[
5.0%
-
5.5%
]
5.12%
5,79891.4%
[
5.5%
-
6.0%
]
5.78%
11,45890.1%
[
7.0%
-
7.5%
]
7.32%
5,47686.5%
[
7.5%
-
8.0%
]
7.83%
70276.9%
[
8.5%
-
9.0%
]
8.50%
29493.7%
[
62.0%
-
62.5%
]
62.16%
37100.0%