Immigrants from Turkey vs Immigrants from South Eastern Asia Married-Couple Family Poverty
COMPARE
Immigrants from Turkey
Immigrants from South Eastern Asia
Married-Couple Family Poverty
Married-Couple Family Poverty Comparison
Immigrants from Turkey
Immigrants from South Eastern Asia
4.6%
MARRIED-COUPLE FAMILY POVERTY
98.6/ 100
METRIC RATING
86th/ 347
METRIC RANK
5.1%
MARRIED-COUPLE FAMILY POVERTY
70.4/ 100
METRIC RATING
158th/ 347
METRIC RANK
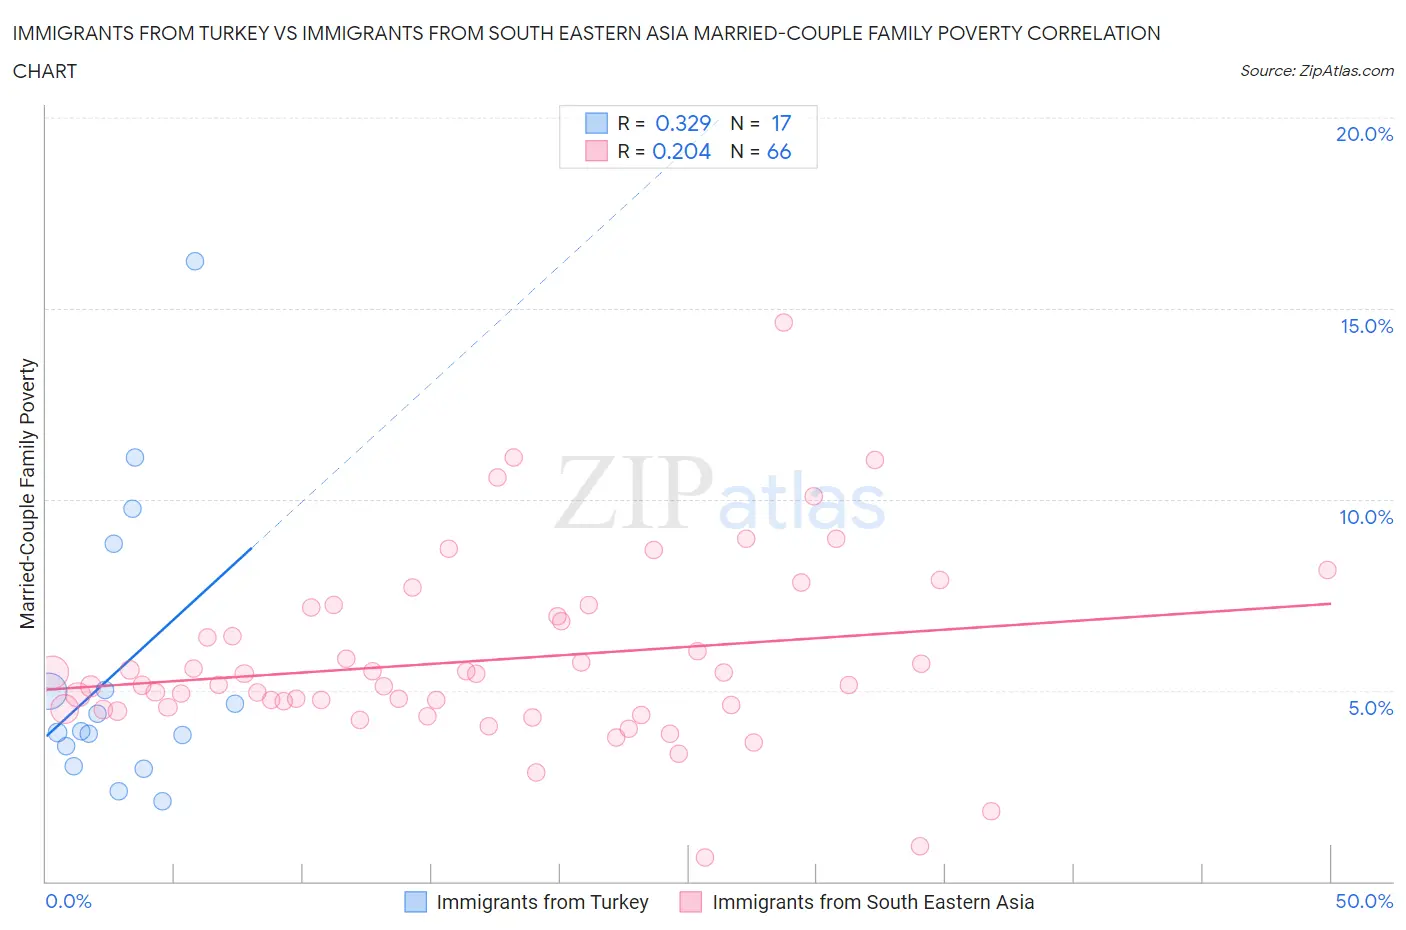
Immigrants from Turkey vs Immigrants from South Eastern Asia Married-Couple Family Poverty Correlation Chart
The statistical analysis conducted on geographies consisting of 221,764,079 people shows a mild positive correlation between the proportion of Immigrants from Turkey and poverty level among married-couple families in the United States with a correlation coefficient (R) of 0.329 and weighted average of 4.6%. Similarly, the statistical analysis conducted on geographies consisting of 504,926,469 people shows a weak positive correlation between the proportion of Immigrants from South Eastern Asia and poverty level among married-couple families in the United States with a correlation coefficient (R) of 0.204 and weighted average of 5.1%, a difference of 11.3%.
Married-Couple Family Poverty Correlation Summary
| Measurement | Immigrants from Turkey | Immigrants from South Eastern Asia |
| Minimum | 2.1% | 0.63% |
| Maximum | 16.2% | 14.6% |
| Range | 14.1% | 14.0% |
| Mean | 5.6% | 5.8% |
| Median | 3.9% | 5.1% |
| Interquartile 25% (IQ1) | 3.3% | 4.5% |
| Interquartile 75% (IQ3) | 6.9% | 6.9% |
| Interquartile Range (IQR) | 3.7% | 2.4% |
| Standard Deviation (Sample) | 3.8% | 2.4% |
| Standard Deviation (Population) | 3.7% | 2.4% |
Similar Demographics by Married-Couple Family Poverty
Demographics Similar to Immigrants from Turkey by Married-Couple Family Poverty
In terms of married-couple family poverty, the demographic groups most similar to Immigrants from Turkey are South African (4.6%, a difference of 0.040%), Immigrants from North Macedonia (4.6%, a difference of 0.080%), Bolivian (4.6%, a difference of 0.18%), Immigrants from Croatia (4.6%, a difference of 0.27%), and Immigrants from Czechoslovakia (4.6%, a difference of 0.29%).
| Demographics | Rating | Rank | Married-Couple Family Poverty |
| Immigrants | Iran | 99.0 /100 | #79 | Exceptional 4.5% |
| Icelanders | 99.0 /100 | #80 | Exceptional 4.5% |
| Immigrants | Greece | 98.9 /100 | #81 | Exceptional 4.5% |
| Canadians | 98.8 /100 | #82 | Exceptional 4.5% |
| Immigrants | Denmark | 98.8 /100 | #83 | Exceptional 4.6% |
| Immigrants | Croatia | 98.7 /100 | #84 | Exceptional 4.6% |
| South Africans | 98.7 /100 | #85 | Exceptional 4.6% |
| Immigrants | Turkey | 98.6 /100 | #86 | Exceptional 4.6% |
| Immigrants | North Macedonia | 98.6 /100 | #87 | Exceptional 4.6% |
| Bolivians | 98.6 /100 | #88 | Exceptional 4.6% |
| Immigrants | Czechoslovakia | 98.5 /100 | #89 | Exceptional 4.6% |
| Immigrants | Switzerland | 98.5 /100 | #90 | Exceptional 4.6% |
| Basques | 98.5 /100 | #91 | Exceptional 4.6% |
| Immigrants | Norway | 98.4 /100 | #92 | Exceptional 4.6% |
| Koreans | 98.3 /100 | #93 | Exceptional 4.6% |
Demographics Similar to Immigrants from South Eastern Asia by Married-Couple Family Poverty
In terms of married-couple family poverty, the demographic groups most similar to Immigrants from South Eastern Asia are Immigrants from Saudi Arabia (5.1%, a difference of 0.0%), Argentinean (5.1%, a difference of 0.050%), Pennsylvania German (5.1%, a difference of 0.26%), Sri Lankan (5.1%, a difference of 0.27%), and Immigrants from Ethiopia (5.1%, a difference of 0.31%).
| Demographics | Rating | Rank | Married-Couple Family Poverty |
| Immigrants | Cameroon | 77.3 /100 | #151 | Good 5.0% |
| Albanians | 77.2 /100 | #152 | Good 5.0% |
| Immigrants | Kuwait | 76.3 /100 | #153 | Good 5.0% |
| Delaware | 73.7 /100 | #154 | Good 5.1% |
| Immigrants | Ethiopia | 72.4 /100 | #155 | Good 5.1% |
| Sri Lankans | 72.2 /100 | #156 | Good 5.1% |
| Argentineans | 70.7 /100 | #157 | Good 5.1% |
| Immigrants | South Eastern Asia | 70.4 /100 | #158 | Good 5.1% |
| Immigrants | Saudi Arabia | 70.3 /100 | #159 | Good 5.1% |
| Pennsylvania Germans | 68.5 /100 | #160 | Good 5.1% |
| Ethiopians | 68.1 /100 | #161 | Good 5.1% |
| Immigrants | Jordan | 66.5 /100 | #162 | Good 5.1% |
| Sierra Leoneans | 64.1 /100 | #163 | Good 5.1% |
| Hawaiians | 62.3 /100 | #164 | Good 5.1% |
| Immigrants | Malaysia | 62.2 /100 | #165 | Good 5.1% |