Immigrants from Turkey 4 or more Vehicles in Household
COMPARE
Immigrants from Turkey
Select to Compare
4 or more Vehicles in Household
Immigrants from Turkey 4 or more Vehicles in Household
5.7%
4+ VEHICLES AVAILABLE
1.5/ 100
METRIC RATING
256th/ 347
METRIC RANK
Immigrants from Turkey 4 or more Vehicles in Household Correlation Chart
The statistical analysis conducted on geographies consisting of 222,044,575 people shows a perfect positive correlation between the proportion of Immigrants from Turkey and percentage of households with 4 or more vehicles available in the United States with a correlation coefficient (R) of 0.977 and weighted average of 5.7%. On average, for every 1% (one percent) increase in Immigrants from Turkey within a typical geography, there is an increase of 0.94% in percentage of households with 4 or more vehicles available.
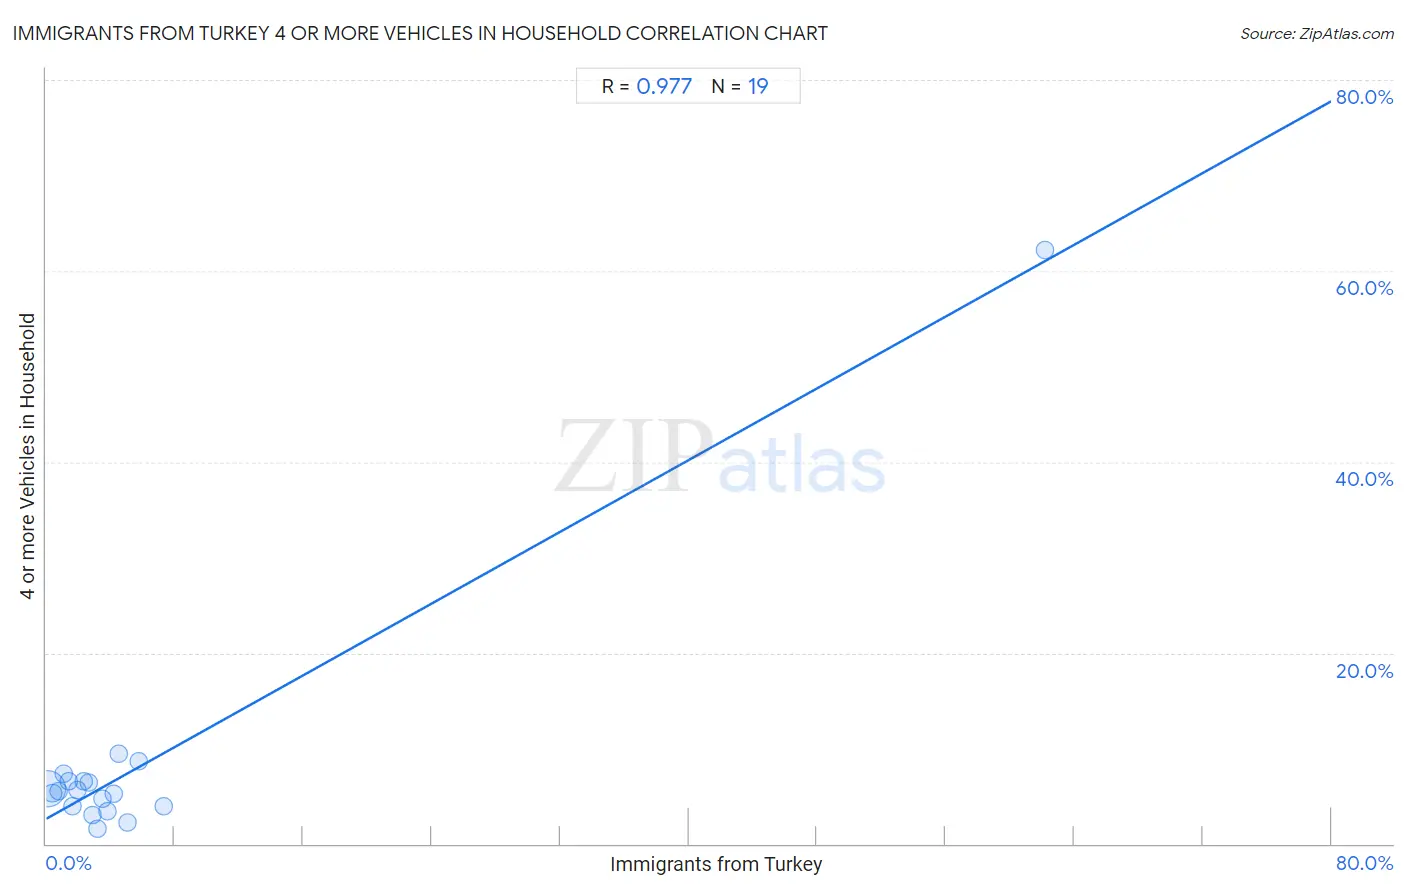
It is essential to understand that the correlation between the percentage of Immigrants from Turkey and percentage of households with 4 or more vehicles available does not imply a direct cause-and-effect relationship. It remains uncertain whether the presence of Immigrants from Turkey influences an upward or downward trend in the level of percentage of households with 4 or more vehicles available within an area, or if Immigrants from Turkey simply ended up residing in those areas with higher or lower levels of percentage of households with 4 or more vehicles available due to other factors.
Demographics Similar to Immigrants from Turkey by 4 or more Vehicles in Household
In terms of 4 or more vehicles in household, the demographic groups most similar to Immigrants from Turkey are Yup'ik (5.7%, a difference of 0.040%), Immigrants from Northern Africa (5.6%, a difference of 0.080%), Immigrants from Panama (5.7%, a difference of 0.12%), Immigrants from Lithuania (5.6%, a difference of 0.22%), and Immigrants from France (5.6%, a difference of 0.25%).
| Demographics | Rating | Rank | 4 or more Vehicles in Household |
| Immigrants from Southern Europe | 2.3 /100 | #249 | Tragic 5.7% |
| Immigrants from Europe | 2.3 /100 | #250 | Tragic 5.7% |
| Ugandans | 2.2 /100 | #251 | Tragic 5.7% |
| Sub-Saharan Africans | 2.1 /100 | #252 | Tragic 5.7% |
| Immigrants from Cuba | 1.6 /100 | #253 | Tragic 5.7% |
| Immigrants from Panama | 1.5 /100 | #254 | Tragic 5.7% |
| Yup'ik | 1.5 /100 | #255 | Tragic 5.7% |
| Immigrants from Turkey | 1.5 /100 | #256 | Tragic 5.7% |
| Immigrants from Northern Africa | 1.4 /100 | #257 | Tragic 5.6% |
| Immigrants from Lithuania | 1.4 /100 | #258 | Tragic 5.6% |
| Immigrants from France | 1.3 /100 | #259 | Tragic 5.6% |
| Uruguayans | 1.3 /100 | #260 | Tragic 5.6% |
| Sudanese | 1.2 /100 | #261 | Tragic 5.6% |
| Bermudans | 1.2 /100 | #262 | Tragic 5.6% |
| Immigrants from Saudi Arabia | 1.1 /100 | #263 | Tragic 5.6% |
Immigrants from Turkey 4 or more Vehicles in Household Correlation Summary
| Measurement | Immigrants from Turkey Data | 4 or more Vehicles in Household Data |
| Minimum | 0.074% | 1.5% |
| Maximum | 62.2% | 62.2% |
| Range | 62.1% | 60.6% |
| Mean | 6.0% | 8.3% |
| Median | 2.8% | 5.5% |
| Interquartile 25% (IQ1) | 1.4% | 3.9% |
| Interquartile 75% (IQ3) | 4.5% | 6.6% |
| Interquartile Range (IQR) | 3.1% | 2.6% |
| Standard Deviation (Sample) | 13.7% | 13.2% |
| Standard Deviation (Population) | 13.4% | 12.9% |
Correlation Details
| Immigrants from Turkey Percentile | Sample Size | 4 or more Vehicles in Household |
[ 0.0% - 0.5% ] 0.074% | 205,144,122 | 5.7% |
[ 0.0% - 0.5% ] 0.43% | 12,670,103 | 5.3% |
[ 0.5% - 1.0% ] 0.77% | 2,324,062 | 5.5% |
[ 1.0% - 1.5% ] 1.06% | 811,322 | 7.4% |
[ 1.0% - 1.5% ] 1.37% | 303,229 | 6.6% |
[ 1.5% - 2.0% ] 1.67% | 297,382 | 3.9% |
[ 1.5% - 2.0% ] 1.98% | 295,971 | 5.6% |
[ 2.0% - 2.5% ] 2.30% | 60,229 | 6.6% |
[ 2.5% - 3.0% ] 2.63% | 43,179 | 6.5% |
[ 2.5% - 3.0% ] 2.85% | 32,612 | 3.0% |
[ 3.0% - 3.5% ] 3.18% | 7,619 | 1.5% |
[ 3.5% - 4.0% ] 3.53% | 11,204 | 4.7% |
[ 3.5% - 4.0% ] 3.78% | 17,240 | 3.5% |
[ 4.0% - 4.5% ] 4.23% | 2,740 | 5.3% |
[ 4.5% - 5.0% ] 4.51% | 2,440 | 9.4% |
[ 5.0% - 5.5% ] 5.06% | 4,150 | 2.2% |
[ 5.5% - 6.0% ] 5.78% | 11,458 | 8.6% |
[ 7.0% - 7.5% ] 7.32% | 5,476 | 4.0% |
[ 62.0% - 62.5% ] 62.16% | 37 | 62.2% |