Immigrants from China Disability
COMPARE
Immigrants from China
Select to Compare
Disability
Immigrants from China Disability
10.1%
DISABILITY
100.0/ 100
METRIC RATING
10th/ 347
METRIC RANK
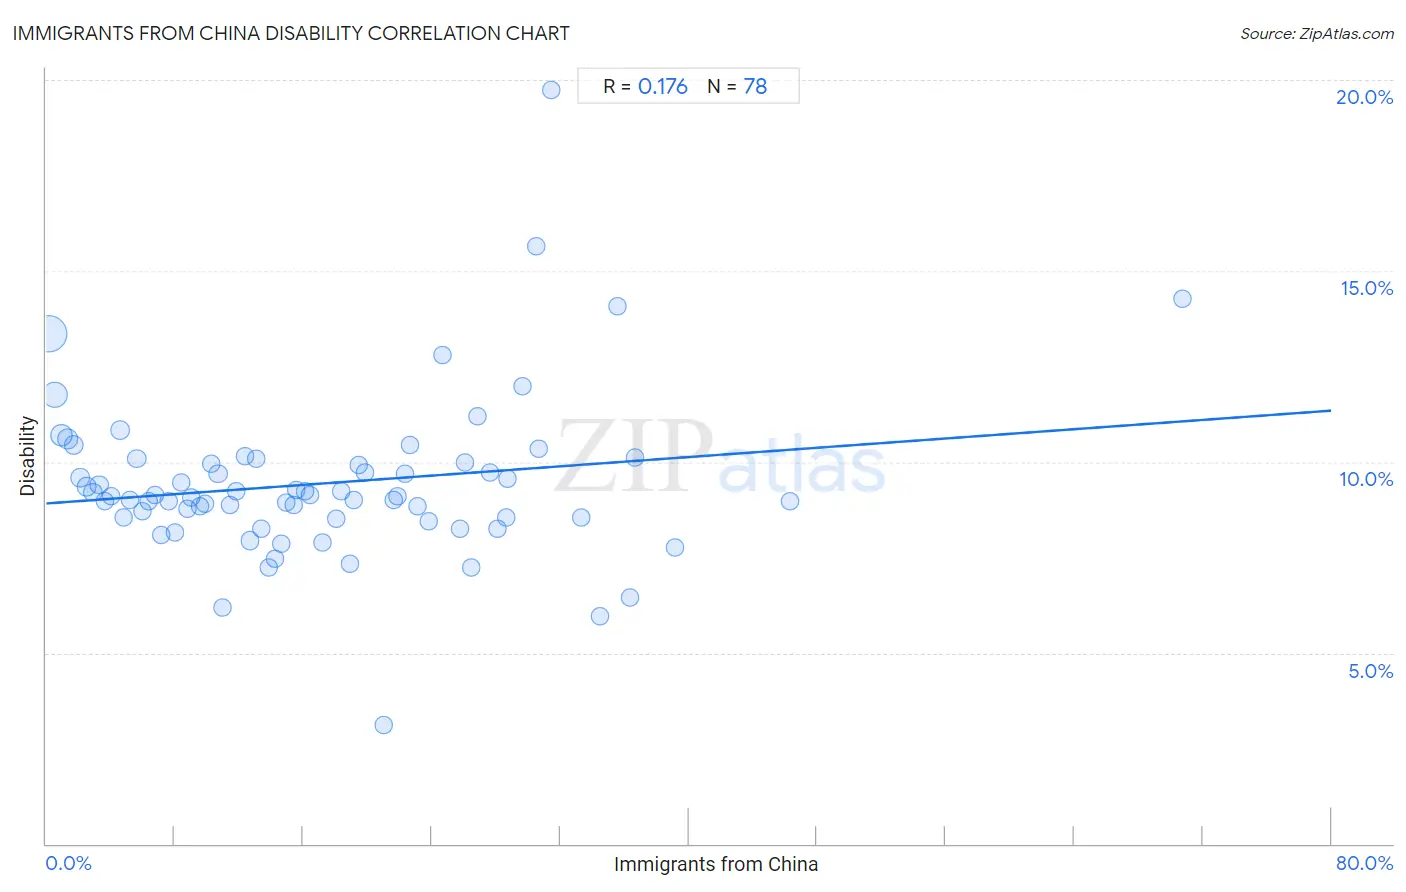
Immigrants from China Disability Correlation Chart
The statistical analysis conducted on geographies consisting of 457,054,974 people shows a poor positive correlation between the proportion of Immigrants from China and percentage of population with a disability in the United States with a correlation coefficient (R) of 0.176 and weighted average of 10.1%. On average, for every 1% (one percent) increase in Immigrants from China within a typical geography, there is an increase of 0.030% in percentage of population with a disability.
It is essential to understand that the correlation between the percentage of Immigrants from China and percentage of population with a disability does not imply a direct cause-and-effect relationship. It remains uncertain whether the presence of Immigrants from China influences an upward or downward trend in the level of percentage of population with a disability within an area, or if Immigrants from China simply ended up residing in those areas with higher or lower levels of percentage of population with a disability due to other factors.
Demographics Similar to Immigrants from China by Disability
In terms of disability, the demographic groups most similar to Immigrants from China are Iranian (10.1%, a difference of 0.010%), Immigrants from Israel (10.1%, a difference of 0.26%), Immigrants from Eastern Asia (10.2%, a difference of 0.47%), Immigrants from Hong Kong (10.0%, a difference of 0.81%), and Immigrants from Korea (10.2%, a difference of 1.1%).
| Demographics | Rating | Rank | Disability |
| Immigrants from Taiwan | 100.0 /100 | #3 | Exceptional 9.6% |
| Thais | 100.0 /100 | #4 | Exceptional 9.7% |
| Immigrants from Bolivia | 100.0 /100 | #5 | Exceptional 9.9% |
| Immigrants from South Central Asia | 100.0 /100 | #6 | Exceptional 9.9% |
| Immigrants from Singapore | 100.0 /100 | #7 | Exceptional 10.0% |
| Bolivians | 100.0 /100 | #8 | Exceptional 10.0% |
| Immigrants from Hong Kong | 100.0 /100 | #9 | Exceptional 10.0% |
| Immigrants from China | 100.0 /100 | #10 | Exceptional 10.1% |
| Iranians | 100.0 /100 | #11 | Exceptional 10.1% |
| Immigrants from Israel | 100.0 /100 | #12 | Exceptional 10.1% |
| Immigrants from Eastern Asia | 100.0 /100 | #13 | Exceptional 10.2% |
| Immigrants from Korea | 100.0 /100 | #14 | Exceptional 10.2% |
| Okinawans | 100.0 /100 | #15 | Exceptional 10.3% |
| Indians (Asian) | 100.0 /100 | #16 | Exceptional 10.3% |
| Immigrants from Iran | 100.0 /100 | #17 | Exceptional 10.3% |
Immigrants from China Disability Correlation Summary
| Measurement | Immigrants from China Data | Disability Data |
| Minimum | 0.17% | 3.1% |
| Maximum | 70.7% | 19.7% |
| Range | 70.6% | 16.6% |
| Mean | 17.2% | 9.4% |
| Median | 15.2% | 9.1% |
| Interquartile 25% (IQ1) | 7.6% | 8.5% |
| Interquartile 75% (IQ3) | 25.7% | 10.0% |
| Interquartile Range (IQR) | 18.1% | 1.4% |
| Standard Deviation (Sample) | 12.5% | 2.2% |
| Standard Deviation (Population) | 12.4% | 2.1% |
Correlation Details
| Immigrants from China Percentile | Sample Size | Disability |
[ 0.0% - 0.5% ] 0.17% | 220,298,466 | 13.3% |
[ 0.5% - 1.0% ] 0.54% | 93,600,917 | 11.8% |
[ 0.5% - 1.0% ] 0.95% | 38,677,628 | 10.7% |
[ 1.0% - 1.5% ] 1.33% | 25,367,086 | 10.6% |
[ 1.5% - 2.0% ] 1.73% | 14,013,981 | 10.4% |
[ 2.0% - 2.5% ] 2.10% | 10,339,127 | 9.6% |
[ 2.5% - 3.0% ] 2.52% | 5,190,218 | 9.3% |
[ 2.5% - 3.0% ] 2.91% | 5,881,412 | 9.2% |
[ 3.0% - 3.5% ] 3.29% | 5,134,761 | 9.4% |
[ 3.5% - 4.0% ] 3.67% | 3,134,260 | 9.0% |
[ 4.0% - 4.5% ] 4.01% | 2,864,988 | 9.1% |
[ 4.5% - 5.0% ] 4.58% | 11,875,099 | 10.8% |
[ 4.5% - 5.0% ] 4.83% | 1,649,820 | 8.5% |
[ 5.0% - 5.5% ] 5.23% | 1,114,173 | 9.0% |
[ 5.5% - 6.0% ] 5.64% | 2,273,863 | 10.1% |
[ 6.0% - 6.5% ] 6.00% | 721,200 | 8.7% |
[ 6.0% - 6.5% ] 6.40% | 1,115,149 | 9.0% |
[ 6.5% - 7.0% ] 6.77% | 1,063,408 | 9.1% |
[ 7.0% - 7.5% ] 7.15% | 1,074,480 | 8.1% |
[ 7.5% - 8.0% ] 7.61% | 714,153 | 9.0% |
[ 7.5% - 8.0% ] 7.99% | 978,196 | 8.2% |
[ 8.0% - 8.5% ] 8.40% | 886,551 | 9.5% |
[ 8.5% - 9.0% ] 8.76% | 351,667 | 8.8% |
[ 9.0% - 9.5% ] 9.04% | 681,745 | 9.1% |
[ 9.5% - 10.0% ] 9.55% | 430,948 | 8.8% |
[ 9.5% - 10.0% ] 9.88% | 606,826 | 8.9% |
[ 10.0% - 10.5% ] 10.25% | 274,217 | 10.0% |
[ 10.5% - 11.0% ] 10.70% | 348,949 | 9.7% |
[ 10.5% - 11.0% ] 10.99% | 435,671 | 6.2% |
[ 11.0% - 11.5% ] 11.41% | 531,653 | 8.9% |
[ 11.5% - 12.0% ] 11.81% | 168,012 | 9.2% |
[ 12.0% - 12.5% ] 12.35% | 1,057,857 | 10.2% |
[ 12.5% - 13.0% ] 12.68% | 389,111 | 7.9% |
[ 13.0% - 13.5% ] 13.06% | 273,868 | 10.1% |
[ 13.0% - 13.5% ] 13.39% | 360,552 | 8.2% |
[ 13.5% - 14.0% ] 13.86% | 120,497 | 7.2% |
[ 14.0% - 14.5% ] 14.27% | 47,350 | 7.5% |
[ 14.5% - 15.0% ] 14.63% | 97,288 | 7.8% |
[ 14.5% - 15.0% ] 14.93% | 110,434 | 9.0% |
[ 15.0% - 15.5% ] 15.39% | 40,627 | 8.9% |
[ 15.5% - 16.0% ] 15.59% | 744 | 9.3% |
[ 16.0% - 16.5% ] 16.11% | 183,427 | 9.2% |
[ 16.0% - 16.5% ] 16.38% | 51,894 | 9.1% |
[ 17.0% - 17.5% ] 17.19% | 148,790 | 7.9% |
[ 18.0% - 18.5% ] 18.02% | 111,247 | 8.5% |
[ 18.0% - 18.5% ] 18.40% | 312,200 | 9.2% |
[ 18.5% - 19.0% ] 18.92% | 113,241 | 7.3% |
[ 19.0% - 19.5% ] 19.18% | 235,005 | 9.0% |
[ 19.0% - 19.5% ] 19.44% | 45,650 | 9.9% |
[ 19.5% - 20.0% ] 19.85% | 131,923 | 9.7% |
[ 20.5% - 21.0% ] 20.98% | 14,204 | 3.1% |
[ 21.5% - 22.0% ] 21.65% | 89,435 | 9.0% |
[ 21.5% - 22.0% ] 21.87% | 143,740 | 9.1% |
[ 22.0% - 22.5% ] 22.31% | 102,223 | 9.7% |
[ 22.5% - 23.0% ] 22.68% | 85,306 | 10.4% |
[ 23.0% - 23.5% ] 23.13% | 24,169 | 8.8% |
[ 23.5% - 24.0% ] 23.82% | 1,100 | 8.5% |
[ 24.5% - 25.0% ] 24.66% | 80,986 | 12.8% |
[ 25.5% - 26.0% ] 25.74% | 134,385 | 8.2% |
[ 26.0% - 26.5% ] 26.09% | 151,983 | 10.0% |
[ 26.0% - 26.5% ] 26.46% | 28,212 | 7.2% |
[ 26.5% - 27.0% ] 26.87% | 68,923 | 11.2% |
[ 27.5% - 28.0% ] 27.63% | 36,165 | 9.7% |
[ 28.0% - 28.5% ] 28.13% | 37,340 | 8.3% |
[ 28.5% - 29.0% ] 28.66% | 52,268 | 8.6% |
[ 28.5% - 29.0% ] 28.73% | 87,947 | 9.6% |
[ 29.5% - 30.0% ] 29.68% | 1,176 | 12.0% |
[ 30.5% - 31.0% ] 30.51% | 25,460 | 15.6% |
[ 30.5% - 31.0% ] 30.69% | 61,340 | 10.4% |
[ 31.0% - 31.5% ] 31.42% | 557 | 19.7% |
[ 33.0% - 33.5% ] 33.33% | 117 | 8.5% |
[ 34.5% - 35.0% ] 34.51% | 1,107 | 6.0% |
[ 35.5% - 36.0% ] 35.57% | 12,070 | 14.1% |
[ 36.0% - 36.5% ] 36.36% | 25,001 | 6.5% |
[ 36.5% - 37.0% ] 36.69% | 26,418 | 10.1% |
[ 39.0% - 39.5% ] 39.16% | 53,371 | 7.8% |
[ 46.0% - 46.5% ] 46.27% | 79,495 | 9.0% |
[ 70.5% - 71.0% ] 70.75% | 147 | 14.3% |