Danish Male Disability
COMPARE
Danish
Select to Compare
Male Disability
Danish Male Disability
11.9%
DISABILITY | MALES
0.9/ 100
METRIC RATING
246th/ 347
METRIC RANK
Danish Male Disability Correlation Chart
The statistical analysis conducted on geographies consisting of 474,081,155 people shows a strong positive correlation between the proportion of Danes and percentage of males with a disability in the United States with a correlation coefficient (R) of 0.716 and weighted average of 11.9%. On average, for every 1% (one percent) increase in Danes within a typical geography, there is an increase of 1.1% in percentage of males with a disability.
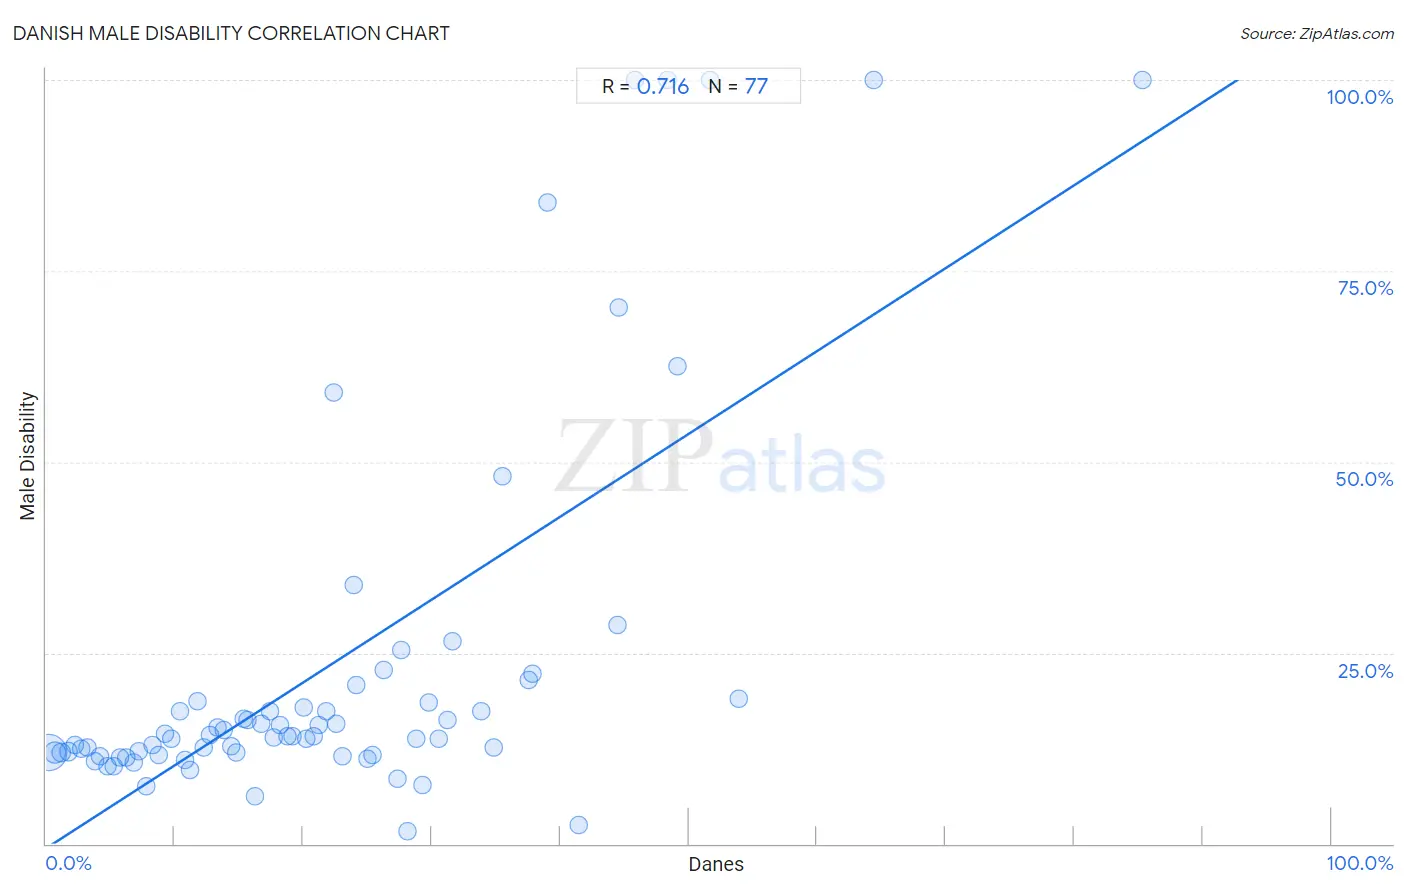
It is essential to understand that the correlation between the percentage of Danes and percentage of males with a disability does not imply a direct cause-and-effect relationship. It remains uncertain whether the presence of Danes influences an upward or downward trend in the level of percentage of males with a disability within an area, or if Danes simply ended up residing in those areas with higher or lower levels of percentage of males with a disability due to other factors.
Demographics Similar to Danes by Male Disability
In terms of male disability, the demographic groups most similar to Danes are Immigrants from Liberia (11.9%, a difference of 0.030%), Immigrants from Laos (11.9%, a difference of 0.040%), Samoan (11.9%, a difference of 0.15%), Northern European (11.9%, a difference of 0.18%), and Bahamian (11.9%, a difference of 0.19%).
| Demographics | Rating | Rank | Male Disability |
| Italians | 1.2 /100 | #239 | Tragic 11.9% |
| Czechs | 1.1 /100 | #240 | Tragic 11.9% |
| Bahamians | 1.1 /100 | #241 | Tragic 11.9% |
| Northern Europeans | 1.1 /100 | #242 | Tragic 11.9% |
| Samoans | 1.1 /100 | #243 | Tragic 11.9% |
| Immigrants from Laos | 1.0 /100 | #244 | Tragic 11.9% |
| Immigrants from Liberia | 1.0 /100 | #245 | Tragic 11.9% |
| Danes | 0.9 /100 | #246 | Tragic 11.9% |
| Hungarians | 0.8 /100 | #247 | Tragic 12.0% |
| Poles | 0.7 /100 | #248 | Tragic 12.0% |
| Immigrants from Yemen | 0.5 /100 | #249 | Tragic 12.0% |
| Bangladeshis | 0.5 /100 | #250 | Tragic 12.0% |
| German Russians | 0.5 /100 | #251 | Tragic 12.0% |
| Slovenes | 0.5 /100 | #252 | Tragic 12.0% |
| Guamanians/Chamorros | 0.5 /100 | #253 | Tragic 12.0% |
Danish Male Disability Correlation Summary
| Measurement | Danish Data | Male Disability Data |
| Minimum | 0.19% | 1.6% |
| Maximum | 85.3% | 100.0% |
| Range | 85.1% | 98.4% |
| Mean | 21.9% | 23.2% |
| Median | 19.2% | 14.1% |
| Interquartile 25% (IQ1) | 9.5% | 11.8% |
| Interquartile 75% (IQ3) | 30.1% | 18.8% |
| Interquartile Range (IQR) | 20.6% | 7.1% |
| Standard Deviation (Sample) | 16.2% | 24.6% |
| Standard Deviation (Population) | 16.1% | 24.4% |
Correlation Details
| Danish Percentile | Sample Size | Male Disability |
[ 0.0% - 0.5% ] 0.19% | 357,169,356 | 12.0% |
[ 0.5% - 1.0% ] 0.71% | 70,260,270 | 12.0% |
[ 1.0% - 1.5% ] 1.20% | 24,630,512 | 11.9% |
[ 1.5% - 2.0% ] 1.70% | 9,022,583 | 12.0% |
[ 2.0% - 2.5% ] 2.24% | 3,223,967 | 13.0% |
[ 2.5% - 3.0% ] 2.73% | 2,011,704 | 12.5% |
[ 3.0% - 3.5% ] 3.22% | 1,487,288 | 12.6% |
[ 3.5% - 4.0% ] 3.75% | 1,683,952 | 10.8% |
[ 4.0% - 4.5% ] 4.21% | 1,162,806 | 11.5% |
[ 4.5% - 5.0% ] 4.73% | 959,633 | 10.1% |
[ 5.0% - 5.5% ] 5.27% | 782,278 | 10.2% |
[ 5.5% - 6.0% ] 5.77% | 471,685 | 11.3% |
[ 6.0% - 6.5% ] 6.18% | 259,733 | 11.2% |
[ 6.5% - 7.0% ] 6.80% | 187,597 | 10.7% |
[ 7.0% - 7.5% ] 7.22% | 133,024 | 12.2% |
[ 7.5% - 8.0% ] 7.74% | 199,907 | 7.5% |
[ 8.0% - 8.5% ] 8.28% | 104,375 | 12.9% |
[ 8.5% - 9.0% ] 8.76% | 60,860 | 11.6% |
[ 9.0% - 9.5% ] 9.25% | 23,393 | 14.4% |
[ 9.5% - 10.0% ] 9.77% | 35,889 | 13.8% |
[ 10.0% - 10.5% ] 10.40% | 17,044 | 17.4% |
[ 10.5% - 11.0% ] 10.75% | 28,424 | 11.0% |
[ 11.0% - 11.5% ] 11.22% | 23,029 | 9.6% |
[ 11.5% - 12.0% ] 11.73% | 8,311 | 18.7% |
[ 12.0% - 12.5% ] 12.24% | 4,657 | 12.6% |
[ 12.5% - 13.0% ] 12.71% | 16,217 | 14.2% |
[ 13.0% - 13.5% ] 13.37% | 15,177 | 15.1% |
[ 13.5% - 14.0% ] 13.77% | 11,079 | 15.0% |
[ 14.0% - 14.5% ] 14.37% | 11,910 | 12.8% |
[ 14.5% - 15.0% ] 14.78% | 6,389 | 11.9% |
[ 15.0% - 15.5% ] 15.34% | 3,058 | 16.4% |
[ 15.5% - 16.0% ] 15.69% | 3,269 | 16.2% |
[ 16.0% - 16.5% ] 16.20% | 1,883 | 6.3% |
[ 16.5% - 17.0% ] 16.73% | 4,979 | 15.7% |
[ 17.0% - 17.5% ] 17.44% | 9,456 | 17.3% |
[ 17.5% - 18.0% ] 17.71% | 3,337 | 14.0% |
[ 18.0% - 18.5% ] 18.17% | 2,223 | 15.5% |
[ 18.5% - 19.0% ] 18.73% | 2,873 | 14.1% |
[ 19.0% - 19.5% ] 19.21% | 4,414 | 14.1% |
[ 20.0% - 20.5% ] 20.00% | 1,120 | 17.8% |
[ 20.0% - 20.5% ] 20.19% | 5,766 | 13.7% |
[ 20.5% - 21.0% ] 20.83% | 72 | 14.1% |
[ 21.0% - 21.5% ] 21.19% | 2,883 | 15.6% |
[ 21.5% - 22.0% ] 21.79% | 5,070 | 17.3% |
[ 22.0% - 22.5% ] 22.37% | 152 | 59.2% |
[ 22.5% - 23.0% ] 22.52% | 222 | 15.7% |
[ 23.0% - 23.5% ] 23.08% | 117 | 11.5% |
[ 23.5% - 24.0% ] 23.90% | 364 | 33.9% |
[ 24.0% - 24.5% ] 24.10% | 83 | 20.8% |
[ 25.0% - 25.5% ] 25.00% | 284 | 11.1% |
[ 25.0% - 25.5% ] 25.41% | 3,199 | 11.6% |
[ 26.0% - 26.5% ] 26.22% | 2,136 | 22.8% |
[ 27.0% - 27.5% ] 27.30% | 989 | 8.6% |
[ 27.5% - 28.0% ] 27.66% | 141 | 25.4% |
[ 28.0% - 28.5% ] 28.16% | 206 | 1.6% |
[ 28.5% - 29.0% ] 28.79% | 3,050 | 13.8% |
[ 29.0% - 29.5% ] 29.27% | 328 | 7.6% |
[ 29.5% - 30.0% ] 29.75% | 2,198 | 18.5% |
[ 30.5% - 31.0% ] 30.53% | 416 | 13.8% |
[ 31.0% - 31.5% ] 31.20% | 407 | 16.2% |
[ 31.5% - 32.0% ] 31.58% | 57 | 26.5% |
[ 33.5% - 34.0% ] 33.82% | 68 | 17.4% |
[ 34.5% - 35.0% ] 34.79% | 891 | 12.5% |
[ 35.0% - 35.5% ] 35.50% | 231 | 48.1% |
[ 37.0% - 37.5% ] 37.50% | 16 | 21.4% |
[ 37.5% - 38.0% ] 37.83% | 875 | 22.3% |
[ 38.5% - 39.0% ] 38.98% | 372 | 83.9% |
[ 41.0% - 41.5% ] 41.45% | 152 | 2.5% |
[ 44.0% - 44.5% ] 44.44% | 9 | 28.6% |
[ 44.5% - 45.0% ] 44.59% | 74 | 70.3% |
[ 45.5% - 46.0% ] 45.83% | 24 | 100.0% |
[ 48.0% - 48.5% ] 48.39% | 62 | 100.0% |
[ 49.0% - 49.5% ] 49.12% | 57 | 62.5% |
[ 51.5% - 52.0% ] 51.61% | 31 | 100.0% |
[ 53.5% - 54.0% ] 53.85% | 104 | 19.0% |
[ 64.0% - 64.5% ] 64.44% | 225 | 100.0% |
[ 85.0% - 85.5% ] 85.28% | 163 | 100.0% |