Danish Unemployment Among Women with Children Ages 6 to 17 years
COMPARE
Danish
Select to Compare
Unemployment Among Women with Children Ages 6 to 17 years
Danish Unemployment Among Women with Children Ages 6 to 17 years
8.1%
UNEMPLOYMENT | WOMEN W/ CHILDREN 6 TO 17
100.0/ 100
METRIC RATING
53rd/ 347
METRIC RANK
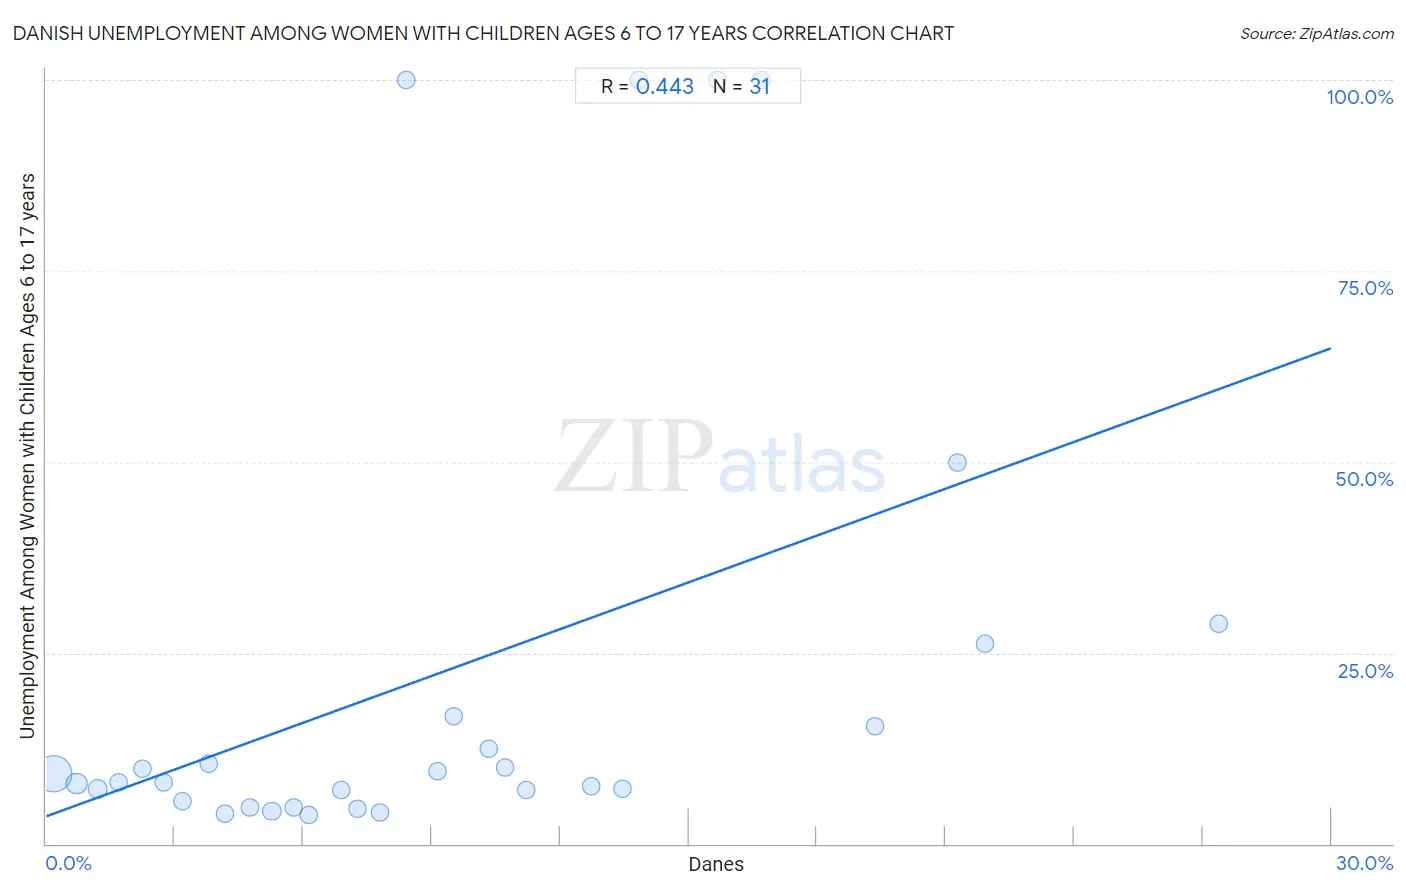
Danish Unemployment Among Women with Children Ages 6 to 17 years Correlation Chart
The statistical analysis conducted on geographies consisting of 314,028,244 people shows a moderate positive correlation between the proportion of Danes and unemployment rate among women with children between the ages 6 and 17 in the United States with a correlation coefficient (R) of 0.443 and weighted average of 8.1%. On average, for every 1% (one percent) increase in Danes within a typical geography, there is an increase of 2.0% in unemployment rate among women with children between the ages 6 and 17.
It is essential to understand that the correlation between the percentage of Danes and unemployment rate among women with children between the ages 6 and 17 does not imply a direct cause-and-effect relationship. It remains uncertain whether the presence of Danes influences an upward or downward trend in the level of unemployment rate among women with children between the ages 6 and 17 within an area, or if Danes simply ended up residing in those areas with higher or lower levels of unemployment rate among women with children between the ages 6 and 17 due to other factors.
Demographics Similar to Danes by Unemployment Among Women with Children Ages 6 to 17 years
In terms of unemployment among women with children ages 6 to 17 years, the demographic groups most similar to Danes are Immigrants from Iraq (8.1%, a difference of 0.060%), Immigrants from Armenia (8.2%, a difference of 0.22%), Immigrants from Japan (8.2%, a difference of 0.29%), Immigrants from Bosnia and Herzegovina (8.2%, a difference of 0.30%), and Immigrants from Laos (8.2%, a difference of 0.32%).
| Demographics | Rating | Rank | Unemployment Among Women with Children Ages 6 to 17 years |
| Icelanders | 100.0 /100 | #46 | Exceptional 8.1% |
| Immigrants from Switzerland | 100.0 /100 | #47 | Exceptional 8.1% |
| Immigrants from Asia | 100.0 /100 | #48 | Exceptional 8.1% |
| Immigrants from Oceania | 100.0 /100 | #49 | Exceptional 8.1% |
| Hawaiians | 100.0 /100 | #50 | Exceptional 8.1% |
| Immigrants from Sudan | 100.0 /100 | #51 | Exceptional 8.1% |
| Immigrants from Iraq | 100.0 /100 | #52 | Exceptional 8.1% |
| Danes | 100.0 /100 | #53 | Exceptional 8.1% |
| Immigrants from Armenia | 100.0 /100 | #54 | Exceptional 8.2% |
| Immigrants from Japan | 100.0 /100 | #55 | Exceptional 8.2% |
| Immigrants from Bosnia and Herzegovina | 100.0 /100 | #56 | Exceptional 8.2% |
| Immigrants from Laos | 100.0 /100 | #57 | Exceptional 8.2% |
| Immigrants from Malaysia | 100.0 /100 | #58 | Exceptional 8.2% |
| Immigrants from Philippines | 100.0 /100 | #59 | Exceptional 8.2% |
| Basques | 100.0 /100 | #60 | Exceptional 8.2% |
Danish Unemployment Among Women with Children Ages 6 to 17 years Correlation Summary
| Measurement | Danish Data | Unemployment Among Women with Children Ages 6 to 17 years Data |
| Minimum | 0.18% | 3.8% |
| Maximum | 27.4% | 100.0% |
| Range | 27.2% | 96.2% |
| Mean | 9.2% | 22.4% |
| Median | 7.8% | 8.1% |
| Interquartile 25% (IQ1) | 3.8% | 5.5% |
| Interquartile 75% (IQ3) | 13.5% | 16.7% |
| Interquartile Range (IQR) | 9.7% | 11.2% |
| Standard Deviation (Sample) | 6.9% | 31.7% |
| Standard Deviation (Population) | 6.8% | 31.2% |
Correlation Details
| Danish Percentile | Sample Size | Unemployment Among Women with Children Ages 6 to 17 years |
[ 0.0% - 0.5% ] 0.18% | 252,396,037 | 9.1% |
[ 0.5% - 1.0% ] 0.71% | 40,291,802 | 7.9% |
[ 1.0% - 1.5% ] 1.19% | 12,367,908 | 7.2% |
[ 1.5% - 2.0% ] 1.69% | 3,884,717 | 8.1% |
[ 2.0% - 2.5% ] 2.26% | 1,108,524 | 9.9% |
[ 2.5% - 3.0% ] 2.75% | 950,416 | 8.0% |
[ 3.0% - 3.5% ] 3.19% | 760,062 | 5.5% |
[ 3.5% - 4.0% ] 3.80% | 487,582 | 10.6% |
[ 4.0% - 4.5% ] 4.18% | 660,036 | 3.9% |
[ 4.5% - 5.0% ] 4.76% | 202,490 | 4.7% |
[ 5.0% - 5.5% ] 5.27% | 394,464 | 4.3% |
[ 5.5% - 6.0% ] 5.79% | 151,198 | 4.8% |
[ 6.0% - 6.5% ] 6.13% | 94,879 | 3.8% |
[ 6.5% - 7.0% ] 6.89% | 81,103 | 7.0% |
[ 7.0% - 7.5% ] 7.28% | 47,080 | 4.7% |
[ 7.5% - 8.0% ] 7.78% | 92,529 | 4.1% |
[ 8.0% - 8.5% ] 8.39% | 143 | 100.0% |
[ 9.0% - 9.5% ] 9.13% | 657 | 9.5% |
[ 9.5% - 10.0% ] 9.52% | 231 | 16.7% |
[ 10.0% - 10.5% ] 10.33% | 1,259 | 12.5% |
[ 10.5% - 11.0% ] 10.70% | 15,733 | 10.1% |
[ 11.0% - 11.5% ] 11.21% | 15,787 | 7.1% |
[ 12.5% - 13.0% ] 12.73% | 8,721 | 7.6% |
[ 13.0% - 13.5% ] 13.46% | 8,954 | 7.2% |
[ 13.5% - 14.0% ] 13.84% | 1,908 | 100.0% |
[ 15.5% - 16.0% ] 15.68% | 236 | 100.0% |
[ 16.5% - 17.0% ] 16.69% | 1,360 | 100.0% |
[ 19.0% - 19.5% ] 19.36% | 501 | 15.4% |
[ 21.0% - 21.5% ] 21.28% | 390 | 50.0% |
[ 21.5% - 22.0% ] 21.91% | 744 | 26.2% |
[ 27.0% - 27.5% ] 27.36% | 793 | 28.8% |