Danish vs Bulgarian Married-Couple Family Poverty
COMPARE
Danish
Bulgarian
Married-Couple Family Poverty
Married-Couple Family Poverty Comparison
Danes
Bulgarians
4.1%
MARRIED-COUPLE FAMILY POVERTY
99.9/ 100
METRIC RATING
27th/ 347
METRIC RANK
4.0%
MARRIED-COUPLE FAMILY POVERTY
100.0/ 100
METRIC RATING
12th/ 347
METRIC RANK
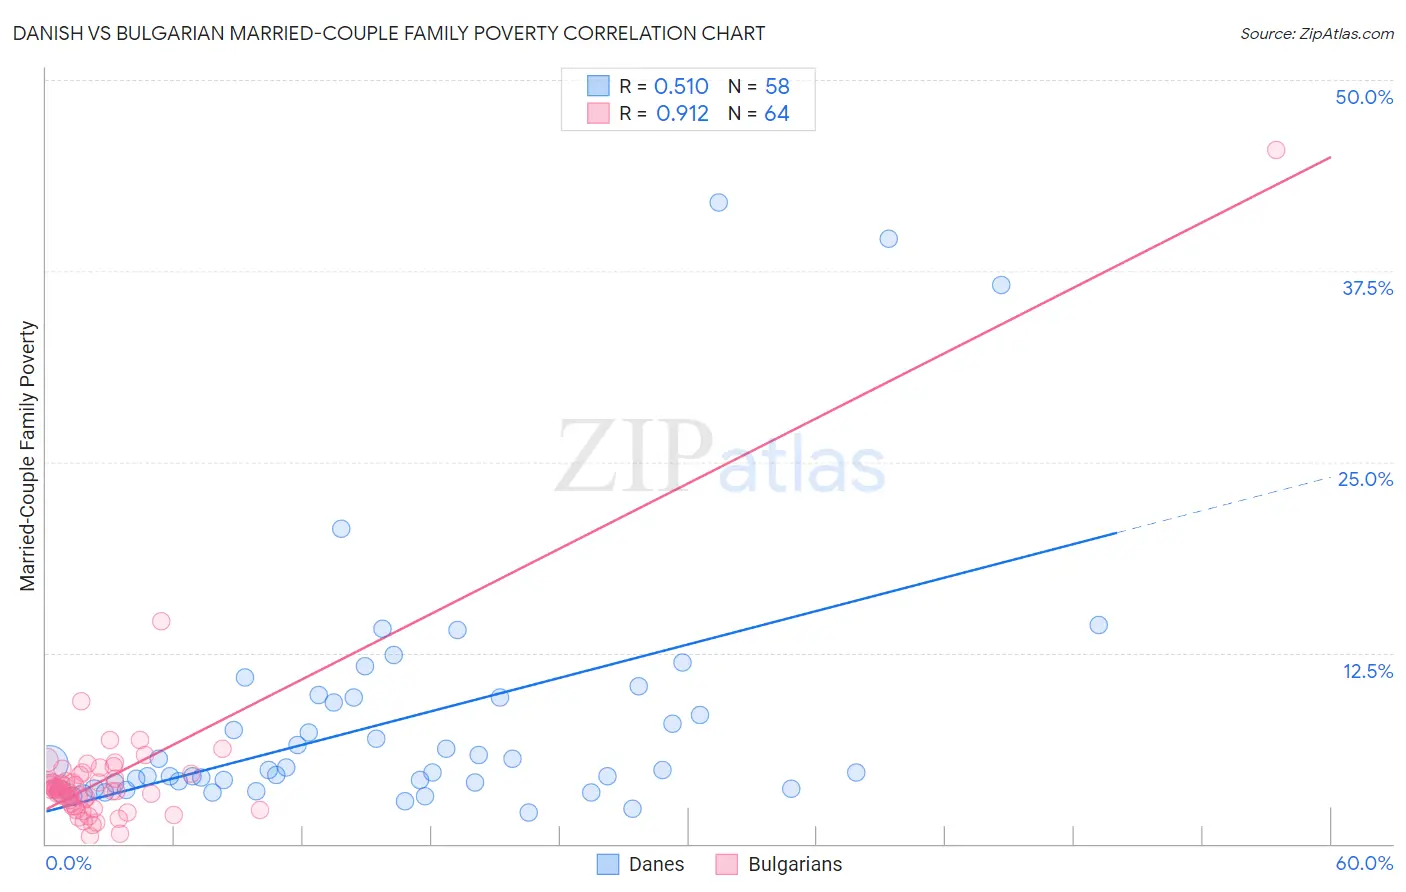
Danish vs Bulgarian Married-Couple Family Poverty Correlation Chart
The statistical analysis conducted on geographies consisting of 466,536,369 people shows a substantial positive correlation between the proportion of Danes and poverty level among married-couple families in the United States with a correlation coefficient (R) of 0.510 and weighted average of 4.1%. Similarly, the statistical analysis conducted on geographies consisting of 204,671,341 people shows a near-perfect positive correlation between the proportion of Bulgarians and poverty level among married-couple families in the United States with a correlation coefficient (R) of 0.912 and weighted average of 4.0%, a difference of 4.0%.
Married-Couple Family Poverty Correlation Summary
| Measurement | Danish | Bulgarian |
| Minimum | 2.0% | 0.47% |
| Maximum | 42.0% | 45.5% |
| Range | 40.0% | 45.0% |
| Mean | 8.1% | 4.4% |
| Median | 4.8% | 3.5% |
| Interquartile 25% (IQ1) | 4.0% | 2.6% |
| Interquartile 75% (IQ3) | 9.5% | 4.4% |
| Interquartile Range (IQR) | 5.6% | 1.8% |
| Standard Deviation (Sample) | 8.3% | 5.6% |
| Standard Deviation (Population) | 8.2% | 5.6% |
Demographics Similar to Danes and Bulgarians by Married-Couple Family Poverty
In terms of married-couple family poverty, the demographic groups most similar to Danes are Cypriot (4.1%, a difference of 0.11%), Scandinavian (4.1%, a difference of 0.11%), Immigrants from Scotland (4.2%, a difference of 0.15%), Immigrants from Taiwan (4.1%, a difference of 0.38%), and Eastern European (4.1%, a difference of 0.96%). Similarly, the demographic groups most similar to Bulgarians are Lithuanian (4.0%, a difference of 0.70%), Czech (4.0%, a difference of 0.88%), Slovak (4.0%, a difference of 0.92%), Polish (4.0%, a difference of 0.95%), and Carpatho Rusyn (3.9%, a difference of 1.2%).
| Demographics | Rating | Rank | Married-Couple Family Poverty |
| Croatians | 100.0 /100 | #9 | Exceptional 3.9% |
| Carpatho Rusyns | 100.0 /100 | #10 | Exceptional 3.9% |
| Lithuanians | 100.0 /100 | #11 | Exceptional 4.0% |
| Bulgarians | 100.0 /100 | #12 | Exceptional 4.0% |
| Czechs | 100.0 /100 | #13 | Exceptional 4.0% |
| Slovaks | 100.0 /100 | #14 | Exceptional 4.0% |
| Poles | 100.0 /100 | #15 | Exceptional 4.0% |
| Germans | 100.0 /100 | #16 | Exceptional 4.0% |
| Filipinos | 100.0 /100 | #17 | Exceptional 4.0% |
| Italians | 100.0 /100 | #18 | Exceptional 4.0% |
| Immigrants | Ireland | 99.9 /100 | #19 | Exceptional 4.1% |
| Maltese | 99.9 /100 | #20 | Exceptional 4.1% |
| Zimbabweans | 99.9 /100 | #21 | Exceptional 4.1% |
| Immigrants | Singapore | 99.9 /100 | #22 | Exceptional 4.1% |
| Bhutanese | 99.9 /100 | #23 | Exceptional 4.1% |
| Eastern Europeans | 99.9 /100 | #24 | Exceptional 4.1% |
| Immigrants | Taiwan | 99.9 /100 | #25 | Exceptional 4.1% |
| Cypriots | 99.9 /100 | #26 | Exceptional 4.1% |
| Danes | 99.9 /100 | #27 | Exceptional 4.1% |
| Scandinavians | 99.9 /100 | #28 | Exceptional 4.1% |
| Immigrants | Scotland | 99.9 /100 | #29 | Exceptional 4.2% |