Danish Self-Care Disability
COMPARE
Danish
Select to Compare
Self-Care Disability
Danish Self-Care Disability
2.3%
SELF-CARE DISABILITY
99.9/ 100
METRIC RATING
31st/ 347
METRIC RANK
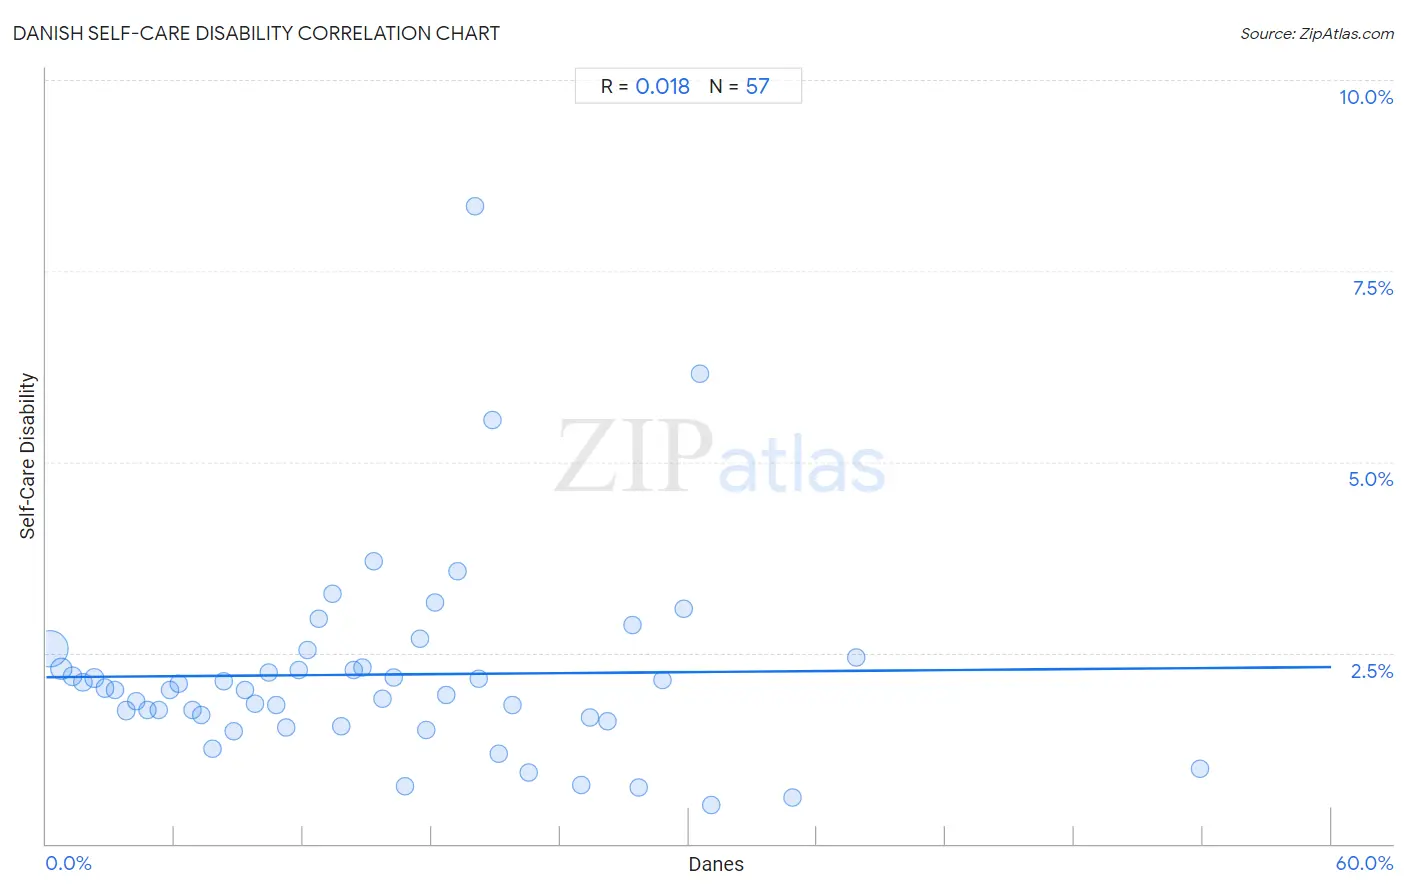
Danish Self-Care Disability Correlation Chart
The statistical analysis conducted on geographies consisting of 473,117,294 people shows no correlation between the proportion of Danes and percentage of population with self-care disability in the United States with a correlation coefficient (R) of 0.018 and weighted average of 2.3%. On average, for every 1% (one percent) increase in Danes within a typical geography, there is an increase of 0.0022% in percentage of population with self-care disability.
It is essential to understand that the correlation between the percentage of Danes and percentage of population with self-care disability does not imply a direct cause-and-effect relationship. It remains uncertain whether the presence of Danes influences an upward or downward trend in the level of percentage of population with self-care disability within an area, or if Danes simply ended up residing in those areas with higher or lower levels of percentage of population with self-care disability due to other factors.
Demographics Similar to Danes by Self-Care Disability
In terms of self-care disability, the demographic groups most similar to Danes are Paraguayan (2.3%, a difference of 0.010%), Burmese (2.3%, a difference of 0.070%), Immigrants from Korea (2.3%, a difference of 0.30%), Immigrants from Zimbabwe (2.3%, a difference of 0.34%), and Immigrants from Turkey (2.3%, a difference of 0.35%).
| Demographics | Rating | Rank | Self-Care Disability |
| Cypriots | 100.0 /100 | #24 | Exceptional 2.2% |
| Turks | 100.0 /100 | #25 | Exceptional 2.2% |
| Immigrants from Sri Lanka | 99.9 /100 | #26 | Exceptional 2.2% |
| Venezuelans | 99.9 /100 | #27 | Exceptional 2.2% |
| Inupiat | 99.9 /100 | #28 | Exceptional 2.2% |
| Immigrants from Zimbabwe | 99.9 /100 | #29 | Exceptional 2.3% |
| Paraguayans | 99.9 /100 | #30 | Exceptional 2.3% |
| Danes | 99.9 /100 | #31 | Exceptional 2.3% |
| Burmese | 99.9 /100 | #32 | Exceptional 2.3% |
| Immigrants from Korea | 99.9 /100 | #33 | Exceptional 2.3% |
| Immigrants from Turkey | 99.9 /100 | #34 | Exceptional 2.3% |
| Immigrants from Australia | 99.9 /100 | #35 | Exceptional 2.3% |
| Immigrants from Lithuania | 99.9 /100 | #36 | Exceptional 2.3% |
| Immigrants from Sweden | 99.9 /100 | #37 | Exceptional 2.3% |
| Immigrants from Eastern Africa | 99.9 /100 | #38 | Exceptional 2.3% |
Danish Self-Care Disability Correlation Summary
| Measurement | Danish Data | Self-Care Disability Data |
| Minimum | 0.19% | 0.50% |
| Maximum | 53.8% | 8.3% |
| Range | 53.7% | 7.8% |
| Mean | 15.5% | 2.2% |
| Median | 14.4% | 2.0% |
| Interquartile 25% (IQ1) | 7.0% | 1.6% |
| Interquartile 75% (IQ3) | 21.4% | 2.4% |
| Interquartile Range (IQR) | 14.4% | 0.75% |
| Standard Deviation (Sample) | 10.8% | 1.3% |
| Standard Deviation (Population) | 10.7% | 1.3% |
Correlation Details
| Danish Percentile | Sample Size | Self-Care Disability |
[ 0.0% - 0.5% ] 0.19% | 356,787,690 | 2.6% |
[ 0.5% - 1.0% ] 0.71% | 70,041,104 | 2.3% |
[ 1.0% - 1.5% ] 1.20% | 24,518,669 | 2.2% |
[ 1.5% - 2.0% ] 1.70% | 8,953,396 | 2.1% |
[ 2.0% - 2.5% ] 2.24% | 3,195,987 | 2.2% |
[ 2.5% - 3.0% ] 2.73% | 1,989,472 | 2.0% |
[ 3.0% - 3.5% ] 3.22% | 1,464,453 | 2.0% |
[ 3.5% - 4.0% ] 3.75% | 1,663,935 | 1.7% |
[ 4.0% - 4.5% ] 4.21% | 1,146,162 | 1.9% |
[ 4.5% - 5.0% ] 4.73% | 947,580 | 1.8% |
[ 5.0% - 5.5% ] 5.27% | 780,443 | 1.8% |
[ 5.5% - 6.0% ] 5.77% | 467,247 | 2.0% |
[ 6.0% - 6.5% ] 6.18% | 253,320 | 2.1% |
[ 6.5% - 7.0% ] 6.80% | 183,787 | 1.8% |
[ 7.0% - 7.5% ] 7.22% | 130,350 | 1.7% |
[ 7.5% - 8.0% ] 7.74% | 197,515 | 1.2% |
[ 8.0% - 8.5% ] 8.28% | 101,902 | 2.1% |
[ 8.5% - 9.0% ] 8.77% | 57,033 | 1.5% |
[ 9.0% - 9.5% ] 9.26% | 20,952 | 2.0% |
[ 9.5% - 10.0% ] 9.77% | 35,033 | 1.8% |
[ 10.0% - 10.5% ] 10.39% | 15,068 | 2.2% |
[ 10.5% - 11.0% ] 10.76% | 26,973 | 1.8% |
[ 11.0% - 11.5% ] 11.22% | 22,618 | 1.5% |
[ 11.5% - 12.0% ] 11.78% | 5,112 | 2.3% |
[ 12.0% - 12.5% ] 12.19% | 2,124 | 2.5% |
[ 12.5% - 13.0% ] 12.72% | 14,945 | 2.9% |
[ 13.0% - 13.5% ] 13.37% | 14,058 | 3.3% |
[ 13.5% - 14.0% ] 13.78% | 10,729 | 1.5% |
[ 14.0% - 14.5% ] 14.37% | 11,526 | 2.3% |
[ 14.5% - 15.0% ] 14.78% | 5,276 | 2.3% |
[ 15.0% - 15.5% ] 15.28% | 1,348 | 3.7% |
[ 15.5% - 16.0% ] 15.70% | 1,567 | 1.9% |
[ 16.0% - 16.5% ] 16.20% | 1,142 | 2.2% |
[ 16.5% - 17.0% ] 16.73% | 4,890 | 0.75% |
[ 17.0% - 17.5% ] 17.43% | 9,137 | 2.7% |
[ 17.5% - 18.0% ] 17.72% | 2,743 | 1.5% |
[ 18.0% - 18.5% ] 18.14% | 1,792 | 3.2% |
[ 18.5% - 19.0% ] 18.68% | 2,248 | 1.9% |
[ 19.0% - 19.5% ] 19.21% | 4,050 | 3.6% |
[ 20.0% - 20.5% ] 20.00% | 300 | 8.3% |
[ 20.0% - 20.5% ] 20.17% | 3,625 | 2.2% |
[ 20.5% - 21.0% ] 20.83% | 72 | 5.6% |
[ 21.0% - 21.5% ] 21.11% | 1,497 | 1.2% |
[ 21.5% - 22.0% ] 21.79% | 4,282 | 1.8% |
[ 22.5% - 23.0% ] 22.52% | 222 | 0.94% |
[ 25.0% - 25.5% ] 25.00% | 288 | 0.78% |
[ 25.0% - 25.5% ] 25.41% | 3,199 | 1.6% |
[ 26.0% - 26.5% ] 26.22% | 2,048 | 1.6% |
[ 27.0% - 27.5% ] 27.36% | 793 | 2.9% |
[ 27.5% - 28.0% ] 27.66% | 141 | 0.73% |
[ 28.5% - 29.0% ] 28.79% | 3,050 | 2.1% |
[ 29.5% - 30.0% ] 29.75% | 2,148 | 3.1% |
[ 30.5% - 31.0% ] 30.53% | 416 | 6.2% |
[ 31.0% - 31.5% ] 31.03% | 203 | 0.50% |
[ 34.5% - 35.0% ] 34.82% | 784 | 0.61% |
[ 37.5% - 38.0% ] 37.80% | 746 | 2.4% |
[ 53.5% - 54.0% ] 53.85% | 104 | 0.99% |