Burmese 3 or more Vehicles in Household
COMPARE
Burmese
Select to Compare
3 or more Vehicles in Household
Burmese 3 or more Vehicles in Household
20.6%
3+ VEHICLES AVAILABLE
95.8/ 100
METRIC RATING
114th/ 347
METRIC RANK
Burmese 3 or more Vehicles in Household Correlation Chart
The statistical analysis conducted on geographies consisting of 464,700,639 people shows a weak positive correlation between the proportion of Burmese and percentage of households with 3 or more vehicles available in the United States with a correlation coefficient (R) of 0.235 and weighted average of 20.6%. On average, for every 1% (one percent) increase in Burmese within a typical geography, there is an increase of 0.22% in percentage of households with 3 or more vehicles available.
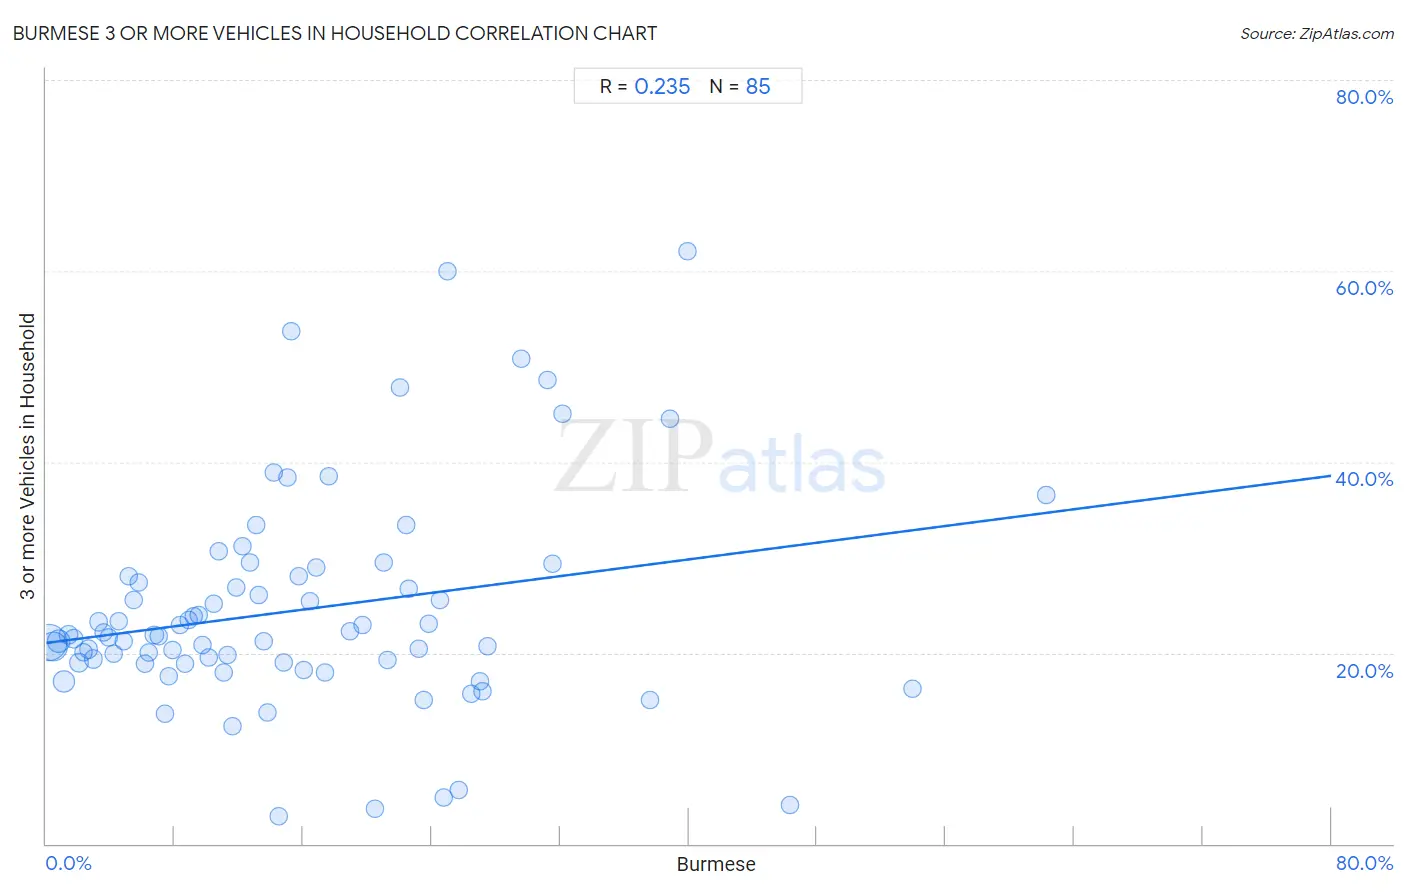
It is essential to understand that the correlation between the percentage of Burmese and percentage of households with 3 or more vehicles available does not imply a direct cause-and-effect relationship. It remains uncertain whether the presence of Burmese influences an upward or downward trend in the level of percentage of households with 3 or more vehicles available within an area, or if Burmese simply ended up residing in those areas with higher or lower levels of percentage of households with 3 or more vehicles available due to other factors.
Demographics Similar to Burmese by 3 or more Vehicles in Household
In terms of 3 or more vehicles in household, the demographic groups most similar to Burmese are Immigrants from England (20.7%, a difference of 0.18%), Nicaraguan (20.7%, a difference of 0.19%), French Canadian (20.6%, a difference of 0.31%), Italian (20.6%, a difference of 0.34%), and Croatian (20.6%, a difference of 0.36%).
| Demographics | Rating | Rank | 3 or more Vehicles in Household |
| Immigrants from Germany | 97.4 /100 | #107 | Exceptional 20.8% |
| Immigrants from Scotland | 97.1 /100 | #108 | Exceptional 20.8% |
| Filipinos | 97.0 /100 | #109 | Exceptional 20.8% |
| Asians | 96.8 /100 | #110 | Exceptional 20.8% |
| Immigrants from Micronesia | 96.7 /100 | #111 | Exceptional 20.7% |
| Nicaraguans | 96.2 /100 | #112 | Exceptional 20.7% |
| Immigrants from England | 96.2 /100 | #113 | Exceptional 20.7% |
| Burmese | 95.8 /100 | #114 | Exceptional 20.6% |
| French Canadians | 95.0 /100 | #115 | Exceptional 20.6% |
| Italians | 94.9 /100 | #116 | Exceptional 20.6% |
| Croatians | 94.9 /100 | #117 | Exceptional 20.6% |
| Costa Ricans | 94.6 /100 | #118 | Exceptional 20.6% |
| Immigrants from Latin America | 94.5 /100 | #119 | Exceptional 20.5% |
| Maltese | 93.9 /100 | #120 | Exceptional 20.5% |
| Immigrants from Thailand | 93.8 /100 | #121 | Exceptional 20.5% |
Burmese 3 or more Vehicles in Household Correlation Summary
| Measurement | Burmese Data | 3 or more Vehicles in Household Data |
| Minimum | 0.15% | 2.8% |
| Maximum | 62.3% | 62.0% |
| Range | 62.1% | 59.2% |
| Mean | 15.8% | 24.5% |
| Median | 13.2% | 21.7% |
| Interquartile 25% (IQ1) | 6.6% | 18.9% |
| Interquartile 75% (IQ3) | 22.9% | 28.0% |
| Interquartile Range (IQR) | 16.3% | 9.1% |
| Standard Deviation (Sample) | 12.2% | 11.4% |
| Standard Deviation (Population) | 12.2% | 11.3% |
Correlation Details
| Burmese Percentile | Sample Size | 3 or more Vehicles in Household |
[ 0.0% - 0.5% ] 0.15% | 193,522,961 | 21.0% |
[ 0.0% - 0.5% ] 0.45% | 110,918,798 | 20.7% |
[ 0.5% - 1.0% ] 0.76% | 52,498,652 | 21.2% |
[ 1.0% - 1.5% ] 1.07% | 34,985,230 | 17.0% |
[ 1.0% - 1.5% ] 1.39% | 17,637,341 | 21.9% |
[ 1.5% - 2.0% ] 1.70% | 13,790,536 | 21.5% |
[ 2.0% - 2.5% ] 2.02% | 8,488,952 | 19.0% |
[ 2.0% - 2.5% ] 2.32% | 5,478,089 | 20.1% |
[ 2.5% - 3.0% ] 2.63% | 3,854,909 | 20.4% |
[ 2.5% - 3.0% ] 2.94% | 7,191,058 | 19.3% |
[ 3.0% - 3.5% ] 3.28% | 2,333,136 | 23.2% |
[ 3.5% - 4.0% ] 3.60% | 1,784,113 | 22.1% |
[ 3.5% - 4.0% ] 3.89% | 1,524,509 | 21.6% |
[ 4.0% - 4.5% ] 4.20% | 1,244,661 | 19.9% |
[ 4.5% - 5.0% ] 4.50% | 1,047,328 | 23.3% |
[ 4.5% - 5.0% ] 4.83% | 641,861 | 21.2% |
[ 5.0% - 5.5% ] 5.17% | 977,543 | 28.0% |
[ 5.0% - 5.5% ] 5.43% | 799,672 | 25.6% |
[ 5.5% - 6.0% ] 5.74% | 306,754 | 27.4% |
[ 6.0% - 6.5% ] 6.11% | 787,439 | 18.8% |
[ 6.0% - 6.5% ] 6.38% | 331,887 | 20.1% |
[ 6.5% - 7.0% ] 6.73% | 236,384 | 21.8% |
[ 6.5% - 7.0% ] 6.99% | 240,201 | 21.7% |
[ 7.0% - 7.5% ] 7.38% | 248,208 | 13.6% |
[ 7.5% - 8.0% ] 7.66% | 125,323 | 17.6% |
[ 7.5% - 8.0% ] 7.87% | 478,031 | 20.3% |
[ 8.0% - 8.5% ] 8.33% | 94,732 | 22.9% |
[ 8.5% - 9.0% ] 8.61% | 135,344 | 18.9% |
[ 8.5% - 9.0% ] 8.87% | 266,988 | 23.4% |
[ 9.0% - 9.5% ] 9.19% | 100,762 | 23.9% |
[ 9.5% - 10.0% ] 9.52% | 146,239 | 24.0% |
[ 9.5% - 10.0% ] 9.75% | 132,937 | 20.8% |
[ 10.0% - 10.5% ] 10.11% | 119,966 | 19.5% |
[ 10.0% - 10.5% ] 10.47% | 35,982 | 25.2% |
[ 10.5% - 11.0% ] 10.77% | 213,237 | 30.6% |
[ 11.0% - 11.5% ] 11.03% | 282,578 | 18.0% |
[ 11.0% - 11.5% ] 11.27% | 42,228 | 19.7% |
[ 11.5% - 12.0% ] 11.58% | 59,410 | 12.3% |
[ 11.5% - 12.0% ] 11.85% | 51,367 | 26.8% |
[ 12.0% - 12.5% ] 12.22% | 27,774 | 31.2% |
[ 12.5% - 13.0% ] 12.68% | 258,950 | 29.5% |
[ 13.0% - 13.5% ] 13.04% | 49,955 | 33.4% |
[ 13.0% - 13.5% ] 13.19% | 234,383 | 26.1% |
[ 13.5% - 14.0% ] 13.57% | 72,955 | 21.2% |
[ 13.5% - 14.0% ] 13.81% | 94,563 | 13.8% |
[ 14.0% - 14.5% ] 14.13% | 92 | 38.9% |
[ 14.0% - 14.5% ] 14.44% | 22,723 | 2.8% |
[ 14.5% - 15.0% ] 14.80% | 152,171 | 19.0% |
[ 15.0% - 15.5% ] 15.04% | 50,419 | 38.3% |
[ 15.0% - 15.5% ] 15.28% | 746 | 53.6% |
[ 15.5% - 16.0% ] 15.71% | 26,355 | 28.0% |
[ 16.0% - 16.5% ] 16.02% | 24,044 | 18.2% |
[ 16.0% - 16.5% ] 16.41% | 20,578 | 25.5% |
[ 16.5% - 17.0% ] 16.79% | 32,737 | 29.0% |
[ 17.0% - 17.5% ] 17.38% | 30,685 | 17.9% |
[ 17.5% - 18.0% ] 17.58% | 5,495 | 38.5% |
[ 18.5% - 19.0% ] 18.92% | 37 | 22.2% |
[ 19.5% - 20.0% ] 19.71% | 10,694 | 22.8% |
[ 20.0% - 20.5% ] 20.45% | 28,984 | 3.7% |
[ 21.0% - 21.5% ] 21.01% | 39,049 | 29.5% |
[ 21.0% - 21.5% ] 21.28% | 141 | 19.2% |
[ 22.0% - 22.5% ] 22.02% | 109 | 47.7% |
[ 22.0% - 22.5% ] 22.41% | 116 | 33.3% |
[ 22.5% - 23.0% ] 22.58% | 62 | 26.7% |
[ 23.0% - 23.5% ] 23.22% | 23,546 | 20.4% |
[ 23.0% - 23.5% ] 23.48% | 133,518 | 15.0% |
[ 23.5% - 24.0% ] 23.80% | 22,930 | 23.0% |
[ 24.5% - 25.0% ] 24.51% | 17,110 | 25.5% |
[ 24.5% - 25.0% ] 24.71% | 37,754 | 4.8% |
[ 25.0% - 25.5% ] 25.00% | 88 | 60.0% |
[ 25.5% - 26.0% ] 25.72% | 43,169 | 5.6% |
[ 26.0% - 26.5% ] 26.49% | 385 | 15.7% |
[ 27.0% - 27.5% ] 27.03% | 111 | 17.0% |
[ 27.0% - 27.5% ] 27.19% | 18,564 | 16.0% |
[ 27.0% - 27.5% ] 27.45% | 11,314 | 20.7% |
[ 29.5% - 30.0% ] 29.61% | 689 | 50.8% |
[ 31.0% - 31.5% ] 31.17% | 324 | 48.6% |
[ 31.5% - 32.0% ] 31.55% | 5,863 | 29.3% |
[ 32.0% - 32.5% ] 32.14% | 280 | 45.1% |
[ 37.5% - 38.0% ] 37.60% | 125 | 15.0% |
[ 38.5% - 39.0% ] 38.87% | 602 | 44.5% |
[ 39.5% - 40.0% ] 39.89% | 351 | 62.0% |
[ 46.0% - 46.5% ] 46.33% | 4,185 | 4.1% |
[ 53.5% - 54.0% ] 53.89% | 40,462 | 16.2% |
[ 62.0% - 62.5% ] 62.26% | 106 | 36.5% |