Burmese Wage/Income Gap
COMPARE
Burmese
Select to Compare
Wage/Income Gap
Burmese Wage/Income Gap
28.0%
WAGE/INCOME GAP
0.5/ 100
METRIC RATING
281st/ 347
METRIC RANK
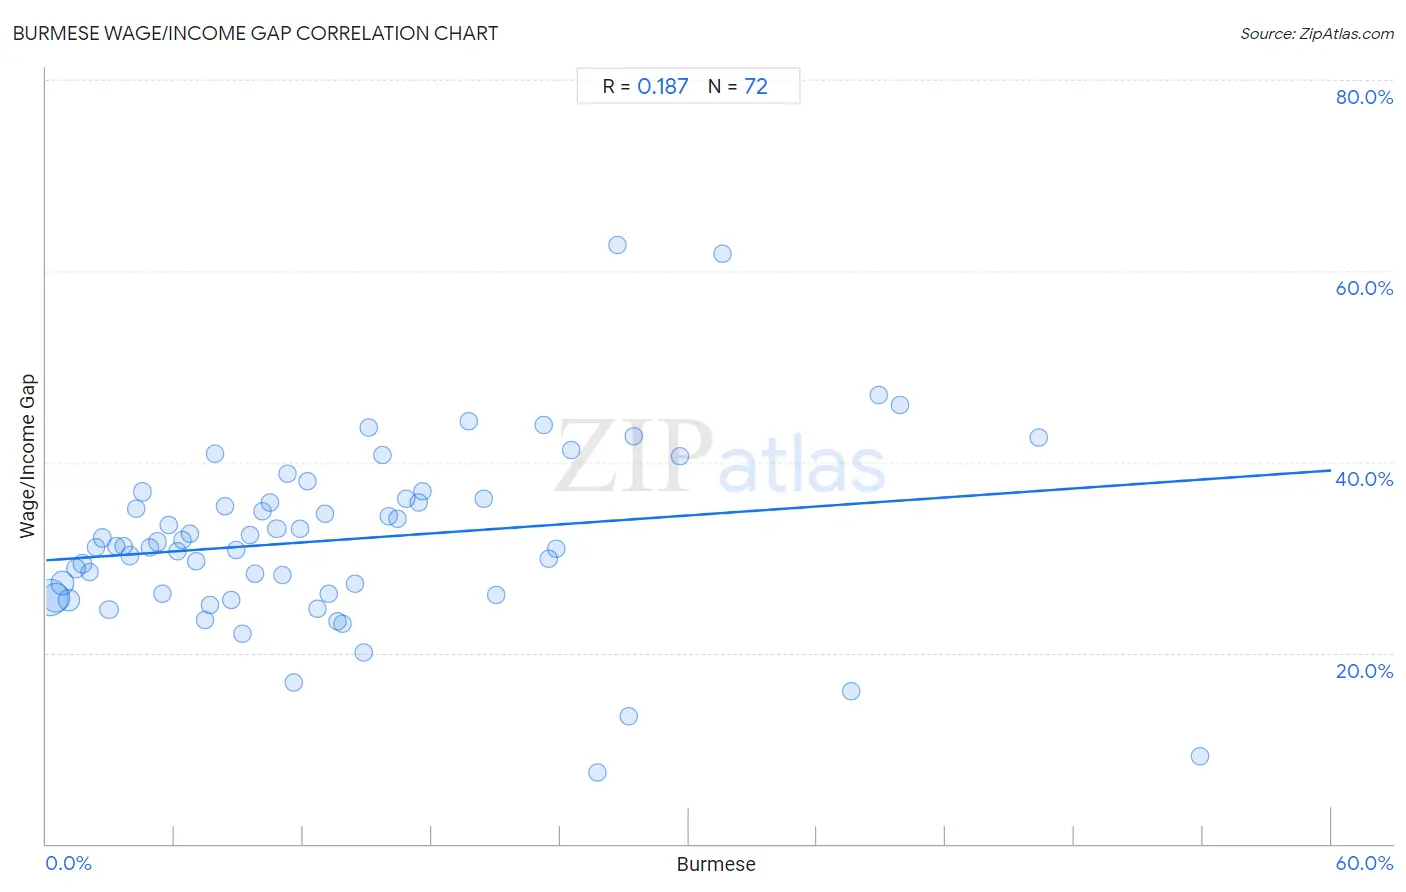
Burmese Wage/Income Gap Correlation Chart
The statistical analysis conducted on geographies consisting of 464,918,136 people shows a poor positive correlation between the proportion of Burmese and wage/income gap percentage in the United States with a correlation coefficient (R) of 0.187 and weighted average of 28.0%. On average, for every 1% (one percent) increase in Burmese within a typical geography, there is an increase of 0.16% in wage/income gap percentage.
It is essential to understand that the correlation between the percentage of Burmese and wage/income gap percentage does not imply a direct cause-and-effect relationship. It remains uncertain whether the presence of Burmese influences an upward or downward trend in the level of wage/income gap percentage within an area, or if Burmese simply ended up residing in those areas with higher or lower levels of wage/income gap percentage due to other factors.
Demographics Similar to Burmese by Wage/Income Gap
In terms of wage/income gap, the demographic groups most similar to Burmese are South African (28.0%, a difference of 0.030%), Russian (28.0%, a difference of 0.050%), Romanian (28.0%, a difference of 0.20%), French Canadian (28.1%, a difference of 0.21%), and Immigrants from Sweden (28.1%, a difference of 0.22%).
| Demographics | Rating | Rank | Wage/Income Gap |
| Americans | 0.7 /100 | #274 | Tragic 27.8% |
| Immigrants from Japan | 0.7 /100 | #275 | Tragic 27.9% |
| Lebanese | 0.7 /100 | #276 | Tragic 27.9% |
| Latvians | 0.7 /100 | #277 | Tragic 27.9% |
| Immigrants from England | 0.6 /100 | #278 | Tragic 27.9% |
| Romanians | 0.5 /100 | #279 | Tragic 28.0% |
| Russians | 0.5 /100 | #280 | Tragic 28.0% |
| Burmese | 0.5 /100 | #281 | Tragic 28.0% |
| South Africans | 0.5 /100 | #282 | Tragic 28.0% |
| French Canadians | 0.4 /100 | #283 | Tragic 28.1% |
| Immigrants from Sweden | 0.4 /100 | #284 | Tragic 28.1% |
| Italians | 0.4 /100 | #285 | Tragic 28.1% |
| Immigrants from Austria | 0.4 /100 | #286 | Tragic 28.1% |
| Okinawans | 0.4 /100 | #287 | Tragic 28.1% |
| Choctaw | 0.4 /100 | #288 | Tragic 28.1% |
Burmese Wage/Income Gap Correlation Summary
| Measurement | Burmese Data | Wage/Income Gap Data |
| Minimum | 0.15% | 7.4% |
| Maximum | 53.9% | 62.7% |
| Range | 53.7% | 55.3% |
| Mean | 13.9% | 31.9% |
| Median | 11.1% | 31.2% |
| Interquartile 25% (IQ1) | 5.6% | 26.1% |
| Interquartile 75% (IQ3) | 18.6% | 36.1% |
| Interquartile Range (IQR) | 13.1% | 10.0% |
| Standard Deviation (Sample) | 11.4% | 9.5% |
| Standard Deviation (Population) | 11.3% | 9.5% |
Correlation Details
| Burmese Percentile | Sample Size | Wage/Income Gap |
[ 0.0% - 0.5% ] 0.15% | 193,498,881 | 25.7% |
[ 0.0% - 0.5% ] 0.45% | 110,956,312 | 25.8% |
[ 0.5% - 1.0% ] 0.76% | 52,519,450 | 27.3% |
[ 1.0% - 1.5% ] 1.07% | 35,034,698 | 25.6% |
[ 1.0% - 1.5% ] 1.39% | 17,704,350 | 28.8% |
[ 1.5% - 2.0% ] 1.70% | 13,815,443 | 29.4% |
[ 2.0% - 2.5% ] 2.02% | 8,498,329 | 28.4% |
[ 2.0% - 2.5% ] 2.32% | 5,479,981 | 31.0% |
[ 2.5% - 3.0% ] 2.63% | 3,873,957 | 32.0% |
[ 2.5% - 3.0% ] 2.94% | 7,195,921 | 24.5% |
[ 3.0% - 3.5% ] 3.28% | 2,348,164 | 31.2% |
[ 3.5% - 4.0% ] 3.60% | 1,792,814 | 31.2% |
[ 3.5% - 4.0% ] 3.89% | 1,527,281 | 30.2% |
[ 4.0% - 4.5% ] 4.20% | 1,245,129 | 35.1% |
[ 4.5% - 5.0% ] 4.50% | 1,056,618 | 36.9% |
[ 4.5% - 5.0% ] 4.83% | 648,422 | 31.0% |
[ 5.0% - 5.5% ] 5.17% | 985,255 | 31.6% |
[ 5.0% - 5.5% ] 5.43% | 808,106 | 26.2% |
[ 5.5% - 6.0% ] 5.74% | 301,146 | 33.4% |
[ 6.0% - 6.5% ] 6.11% | 786,976 | 30.6% |
[ 6.0% - 6.5% ] 6.37% | 336,300 | 31.9% |
[ 6.5% - 7.0% ] 6.73% | 240,669 | 32.4% |
[ 6.5% - 7.0% ] 6.99% | 239,771 | 29.6% |
[ 7.0% - 7.5% ] 7.38% | 246,770 | 23.5% |
[ 7.5% - 8.0% ] 7.66% | 132,913 | 25.0% |
[ 7.5% - 8.0% ] 7.87% | 477,967 | 40.8% |
[ 8.0% - 8.5% ] 8.33% | 93,190 | 35.4% |
[ 8.5% - 9.0% ] 8.61% | 134,142 | 25.6% |
[ 8.5% - 9.0% ] 8.87% | 264,075 | 30.8% |
[ 9.0% - 9.5% ] 9.19% | 98,026 | 22.0% |
[ 9.5% - 10.0% ] 9.52% | 145,070 | 32.3% |
[ 9.5% - 10.0% ] 9.75% | 132,937 | 28.2% |
[ 10.0% - 10.5% ] 10.11% | 119,966 | 34.9% |
[ 10.0% - 10.5% ] 10.47% | 35,220 | 35.7% |
[ 10.5% - 11.0% ] 10.77% | 210,681 | 33.0% |
[ 11.0% - 11.5% ] 11.03% | 282,578 | 28.2% |
[ 11.0% - 11.5% ] 11.27% | 40,914 | 38.8% |
[ 11.5% - 12.0% ] 11.58% | 59,410 | 16.8% |
[ 11.5% - 12.0% ] 11.85% | 51,367 | 33.0% |
[ 12.0% - 12.5% ] 12.22% | 27,774 | 38.0% |
[ 12.5% - 13.0% ] 12.68% | 258,296 | 24.6% |
[ 13.0% - 13.5% ] 13.04% | 49,955 | 34.5% |
[ 13.0% - 13.5% ] 13.19% | 232,957 | 26.2% |
[ 13.5% - 14.0% ] 13.57% | 72,859 | 23.3% |
[ 13.5% - 14.0% ] 13.81% | 93,823 | 23.0% |
[ 14.0% - 14.5% ] 14.44% | 22,723 | 27.2% |
[ 14.5% - 15.0% ] 14.80% | 151,768 | 20.1% |
[ 15.0% - 15.5% ] 15.04% | 50,419 | 43.7% |
[ 15.5% - 16.0% ] 15.71% | 25,382 | 40.8% |
[ 16.0% - 16.5% ] 16.02% | 24,044 | 34.3% |
[ 16.0% - 16.5% ] 16.41% | 20,578 | 34.1% |
[ 16.5% - 17.0% ] 16.79% | 32,344 | 36.2% |
[ 17.0% - 17.5% ] 17.38% | 30,685 | 35.8% |
[ 17.5% - 18.0% ] 17.58% | 5,495 | 37.0% |
[ 19.5% - 20.0% ] 19.71% | 10,694 | 44.2% |
[ 20.0% - 20.5% ] 20.45% | 28,788 | 36.1% |
[ 21.0% - 21.5% ] 21.01% | 39,049 | 26.1% |
[ 23.0% - 23.5% ] 23.22% | 23,546 | 43.8% |
[ 23.0% - 23.5% ] 23.48% | 132,379 | 29.8% |
[ 23.5% - 24.0% ] 23.80% | 22,930 | 30.9% |
[ 24.5% - 25.0% ] 24.51% | 17,110 | 41.3% |
[ 25.5% - 26.0% ] 25.72% | 43,169 | 7.4% |
[ 26.5% - 27.0% ] 26.67% | 15 | 62.7% |
[ 27.0% - 27.5% ] 27.19% | 18,564 | 13.4% |
[ 27.0% - 27.5% ] 27.45% | 11,314 | 42.7% |
[ 29.5% - 30.0% ] 29.61% | 689 | 40.6% |
[ 31.5% - 32.0% ] 31.55% | 5,863 | 61.8% |
[ 37.5% - 38.0% ] 37.60% | 125 | 16.0% |
[ 38.5% - 39.0% ] 38.87% | 602 | 47.1% |
[ 39.5% - 40.0% ] 39.89% | 351 | 45.9% |
[ 46.0% - 46.5% ] 46.33% | 4,185 | 42.6% |
[ 53.5% - 54.0% ] 53.89% | 40,462 | 9.2% |