Burmese 4 or more Vehicles in Household
COMPARE
Burmese
Select to Compare
4 or more Vehicles in Household
Burmese 4 or more Vehicles in Household
6.8%
4+ VEHICLES AVAILABLE
95.7/ 100
METRIC RATING
117th/ 347
METRIC RANK
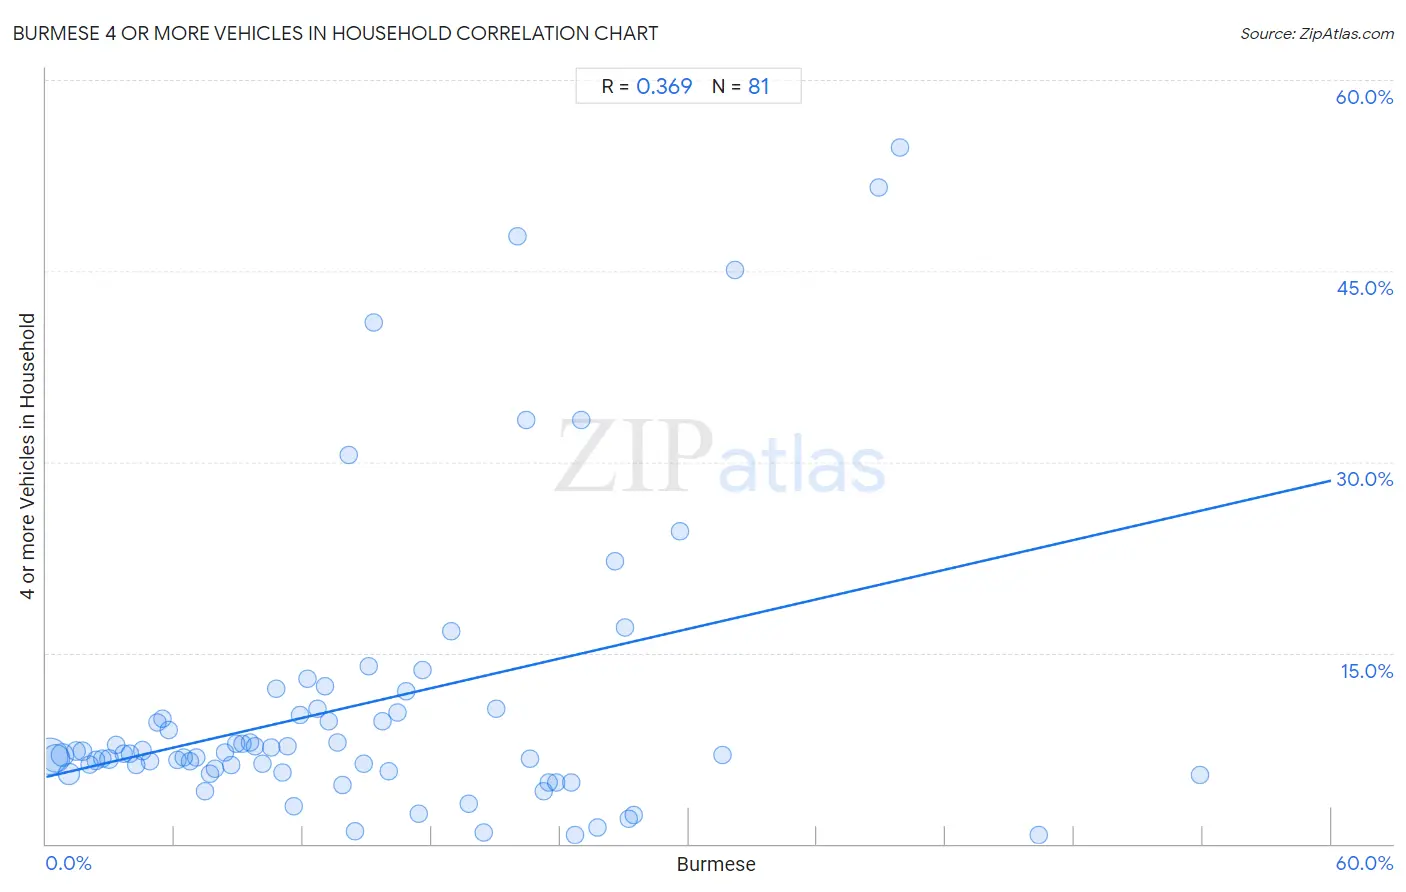
Burmese 4 or more Vehicles in Household Correlation Chart
The statistical analysis conducted on geographies consisting of 462,835,360 people shows a mild positive correlation between the proportion of Burmese and percentage of households with 4 or more vehicles available in the United States with a correlation coefficient (R) of 0.369 and weighted average of 6.8%. On average, for every 1% (one percent) increase in Burmese within a typical geography, there is an increase of 0.39% in percentage of households with 4 or more vehicles available.
It is essential to understand that the correlation between the percentage of Burmese and percentage of households with 4 or more vehicles available does not imply a direct cause-and-effect relationship. It remains uncertain whether the presence of Burmese influences an upward or downward trend in the level of percentage of households with 4 or more vehicles available within an area, or if Burmese simply ended up residing in those areas with higher or lower levels of percentage of households with 4 or more vehicles available due to other factors.
Demographics Similar to Burmese by 4 or more Vehicles in Household
In terms of 4 or more vehicles in household, the demographic groups most similar to Burmese are French American Indian (6.8%, a difference of 0.0%), Immigrants from Guatemala (6.8%, a difference of 0.020%), Costa Rican (6.8%, a difference of 0.11%), Tlingit-Haida (6.8%, a difference of 0.28%), and Bolivian (6.8%, a difference of 0.34%).
| Demographics | Rating | Rank | 4 or more Vehicles in Household |
| Immigrants from Thailand | 97.0 /100 | #110 | Exceptional 6.9% |
| Aleuts | 97.0 /100 | #111 | Exceptional 6.9% |
| Hopi | 97.0 /100 | #112 | Exceptional 6.9% |
| Canadians | 96.4 /100 | #113 | Exceptional 6.9% |
| Bolivians | 96.3 /100 | #114 | Exceptional 6.8% |
| Tlingit-Haida | 96.2 /100 | #115 | Exceptional 6.8% |
| Immigrants from Guatemala | 95.8 /100 | #116 | Exceptional 6.8% |
| Burmese | 95.7 /100 | #117 | Exceptional 6.8% |
| French American Indians | 95.7 /100 | #118 | Exceptional 6.8% |
| Costa Ricans | 95.5 /100 | #119 | Exceptional 6.8% |
| Comanche | 94.8 /100 | #120 | Exceptional 6.8% |
| Immigrants from Germany | 94.7 /100 | #121 | Exceptional 6.8% |
| Immigrants from Nicaragua | 94.7 /100 | #122 | Exceptional 6.8% |
| Immigrants | 94.6 /100 | #123 | Exceptional 6.8% |
| Immigrants from Asia | 94.4 /100 | #124 | Exceptional 6.8% |
Burmese 4 or more Vehicles in Household Correlation Summary
| Measurement | Burmese Data | 4 or more Vehicles in Household Data |
| Minimum | 0.15% | 0.69% |
| Maximum | 53.9% | 54.7% |
| Range | 53.7% | 54.0% |
| Mean | 14.7% | 10.9% |
| Median | 12.7% | 7.1% |
| Interquartile 25% (IQ1) | 6.3% | 5.6% |
| Interquartile 75% (IQ3) | 22.2% | 10.4% |
| Interquartile Range (IQR) | 16.0% | 4.8% |
| Standard Deviation (Sample) | 10.9% | 11.5% |
| Standard Deviation (Population) | 10.9% | 11.4% |
Correlation Details
| Burmese Percentile | Sample Size | 4 or more Vehicles in Household |
[ 0.0% - 0.5% ] 0.15% | 193,061,501 | 6.9% |
[ 0.0% - 0.5% ] 0.45% | 110,665,672 | 6.7% |
[ 0.5% - 1.0% ] 0.76% | 52,230,159 | 7.0% |
[ 1.0% - 1.5% ] 1.07% | 34,766,539 | 5.5% |
[ 1.0% - 1.5% ] 1.39% | 17,594,017 | 7.3% |
[ 1.5% - 2.0% ] 1.70% | 13,669,725 | 7.2% |
[ 2.0% - 2.5% ] 2.02% | 8,358,685 | 6.2% |
[ 2.0% - 2.5% ] 2.32% | 5,415,430 | 6.6% |
[ 2.5% - 3.0% ] 2.63% | 3,816,522 | 6.7% |
[ 2.5% - 3.0% ] 2.94% | 7,142,344 | 6.7% |
[ 3.0% - 3.5% ] 3.28% | 2,312,900 | 7.8% |
[ 3.5% - 4.0% ] 3.60% | 1,730,799 | 7.1% |
[ 3.5% - 4.0% ] 3.89% | 1,509,205 | 7.1% |
[ 4.0% - 4.5% ] 4.20% | 1,240,784 | 6.2% |
[ 4.0% - 4.5% ] 4.50% | 1,030,000 | 7.3% |
[ 4.5% - 5.0% ] 4.83% | 641,507 | 6.5% |
[ 5.0% - 5.5% ] 5.17% | 969,276 | 9.5% |
[ 5.0% - 5.5% ] 5.43% | 769,197 | 9.9% |
[ 5.5% - 6.0% ] 5.74% | 306,754 | 8.9% |
[ 6.0% - 6.5% ] 6.11% | 787,439 | 6.6% |
[ 6.0% - 6.5% ] 6.39% | 296,126 | 6.7% |
[ 6.5% - 7.0% ] 6.73% | 231,189 | 6.5% |
[ 6.5% - 7.0% ] 6.99% | 239,771 | 6.7% |
[ 7.0% - 7.5% ] 7.38% | 247,701 | 4.2% |
[ 7.5% - 8.0% ] 7.66% | 124,355 | 5.5% |
[ 7.5% - 8.0% ] 7.87% | 477,878 | 5.9% |
[ 8.0% - 8.5% ] 8.34% | 91,854 | 7.1% |
[ 8.5% - 9.0% ] 8.61% | 135,344 | 6.2% |
[ 8.5% - 9.0% ] 8.87% | 266,988 | 7.9% |
[ 9.0% - 9.5% ] 9.19% | 100,762 | 7.9% |
[ 9.5% - 10.0% ] 9.52% | 145,654 | 8.0% |
[ 9.5% - 10.0% ] 9.75% | 128,463 | 7.6% |
[ 10.0% - 10.5% ] 10.11% | 119,966 | 6.3% |
[ 10.0% - 10.5% ] 10.49% | 31,403 | 7.6% |
[ 10.5% - 11.0% ] 10.77% | 213,237 | 12.1% |
[ 11.0% - 11.5% ] 11.03% | 282,578 | 5.6% |
[ 11.0% - 11.5% ] 11.27% | 40,914 | 7.7% |
[ 11.5% - 12.0% ] 11.58% | 59,410 | 3.0% |
[ 11.5% - 12.0% ] 11.85% | 51,367 | 10.1% |
[ 12.0% - 12.5% ] 12.22% | 27,774 | 12.9% |
[ 12.5% - 13.0% ] 12.68% | 258,950 | 10.6% |
[ 13.0% - 13.5% ] 13.04% | 49,955 | 12.4% |
[ 13.0% - 13.5% ] 13.19% | 233,250 | 9.6% |
[ 13.5% - 14.0% ] 13.57% | 72,955 | 8.0% |
[ 13.5% - 14.0% ] 13.81% | 85,290 | 4.6% |
[ 14.0% - 14.5% ] 14.13% | 92 | 30.6% |
[ 14.0% - 14.5% ] 14.44% | 22,723 | 0.95% |
[ 14.5% - 15.0% ] 14.80% | 152,171 | 6.3% |
[ 15.0% - 15.5% ] 15.04% | 50,419 | 13.9% |
[ 15.0% - 15.5% ] 15.28% | 746 | 40.9% |
[ 15.5% - 16.0% ] 15.71% | 25,811 | 9.6% |
[ 16.0% - 16.5% ] 16.02% | 24,044 | 5.7% |
[ 16.0% - 16.5% ] 16.41% | 20,578 | 10.3% |
[ 16.5% - 17.0% ] 16.79% | 32,737 | 12.0% |
[ 17.0% - 17.5% ] 17.38% | 30,685 | 2.3% |
[ 17.5% - 18.0% ] 17.58% | 5,495 | 13.6% |
[ 18.5% - 19.0% ] 18.92% | 37 | 16.7% |
[ 19.5% - 20.0% ] 19.71% | 10,694 | 3.1% |
[ 20.0% - 20.5% ] 20.45% | 28,984 | 0.89% |
[ 21.0% - 21.5% ] 21.01% | 39,049 | 10.6% |
[ 22.0% - 22.5% ] 22.02% | 109 | 47.7% |
[ 22.0% - 22.5% ] 22.41% | 116 | 33.3% |
[ 22.5% - 23.0% ] 22.58% | 62 | 6.7% |
[ 23.0% - 23.5% ] 23.22% | 23,546 | 4.1% |
[ 23.0% - 23.5% ] 23.48% | 132,379 | 4.8% |
[ 23.5% - 24.0% ] 23.80% | 22,930 | 4.8% |
[ 24.5% - 25.0% ] 24.51% | 17,110 | 4.9% |
[ 24.5% - 25.0% ] 24.71% | 37,754 | 0.69% |
[ 25.0% - 25.5% ] 25.00% | 88 | 33.3% |
[ 25.5% - 26.0% ] 25.72% | 43,169 | 1.3% |
[ 26.5% - 27.0% ] 26.56% | 64 | 22.2% |
[ 27.0% - 27.5% ] 27.03% | 111 | 17.0% |
[ 27.0% - 27.5% ] 27.19% | 18,564 | 1.9% |
[ 27.0% - 27.5% ] 27.45% | 11,314 | 2.3% |
[ 29.5% - 30.0% ] 29.61% | 689 | 24.6% |
[ 31.5% - 32.0% ] 31.55% | 5,863 | 7.0% |
[ 32.0% - 32.5% ] 32.14% | 280 | 45.1% |
[ 38.5% - 39.0% ] 38.89% | 360 | 51.6% |
[ 39.5% - 40.0% ] 39.89% | 351 | 54.7% |
[ 46.0% - 46.5% ] 46.33% | 4,185 | 0.71% |
[ 53.5% - 54.0% ] 53.89% | 40,462 | 5.4% |