Burmese Self-Care Disability
COMPARE
Burmese
Select to Compare
Self-Care Disability
Burmese Self-Care Disability
2.3%
SELF-CARE DISABILITY
99.9/ 100
METRIC RATING
32nd/ 347
METRIC RANK
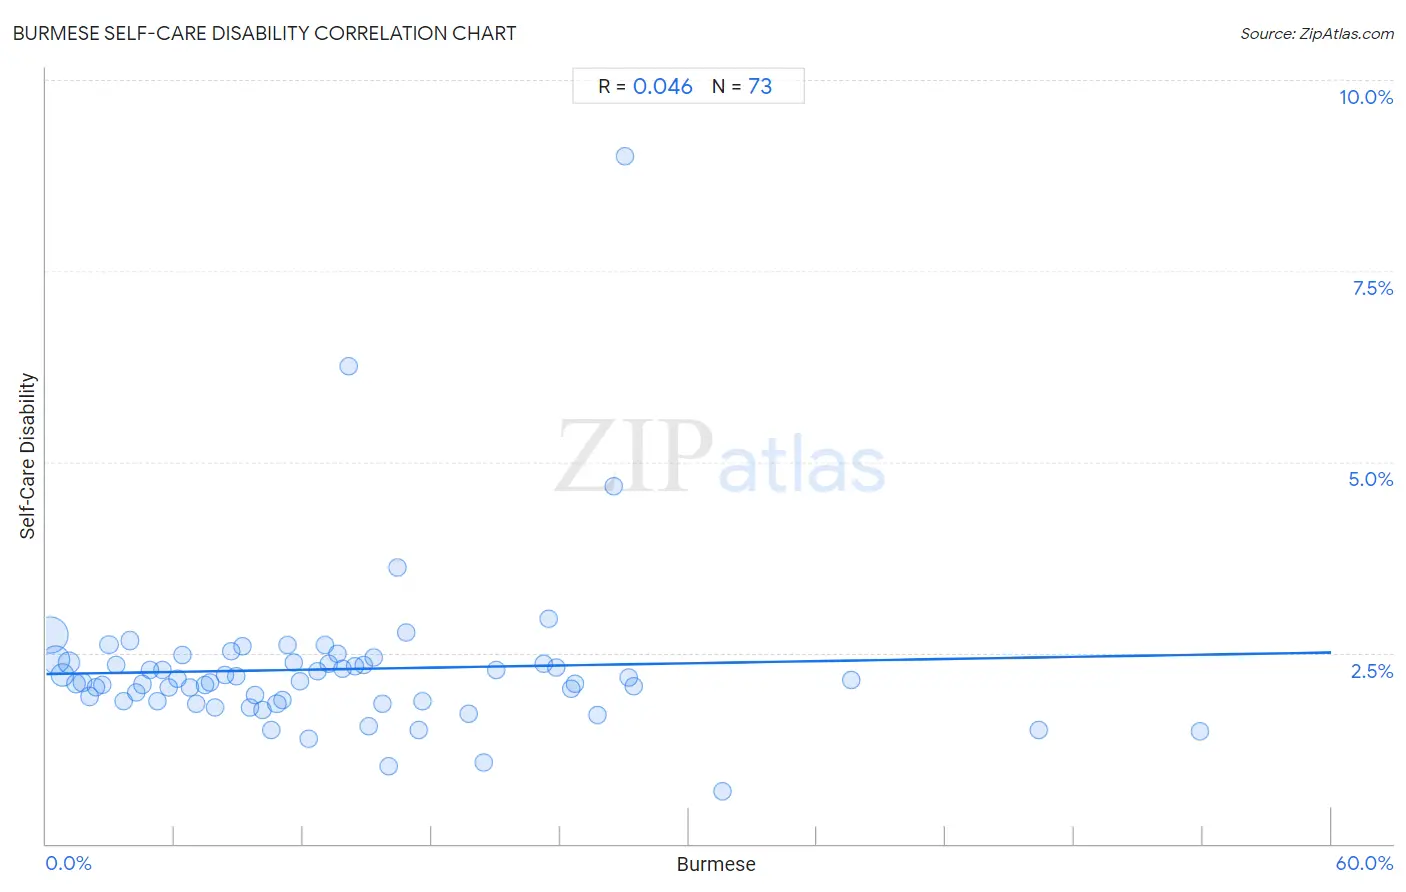
Burmese Self-Care Disability Correlation Chart
The statistical analysis conducted on geographies consisting of 464,418,489 people shows no correlation between the proportion of Burmese and percentage of population with self-care disability in the United States with a correlation coefficient (R) of 0.046 and weighted average of 2.3%. On average, for every 1% (one percent) increase in Burmese within a typical geography, there is an increase of 0.0047% in percentage of population with self-care disability.
It is essential to understand that the correlation between the percentage of Burmese and percentage of population with self-care disability does not imply a direct cause-and-effect relationship. It remains uncertain whether the presence of Burmese influences an upward or downward trend in the level of percentage of population with self-care disability within an area, or if Burmese simply ended up residing in those areas with higher or lower levels of percentage of population with self-care disability due to other factors.
Demographics Similar to Burmese by Self-Care Disability
In terms of self-care disability, the demographic groups most similar to Burmese are Danish (2.3%, a difference of 0.070%), Paraguayan (2.3%, a difference of 0.080%), Immigrants from Korea (2.3%, a difference of 0.23%), Immigrants from Turkey (2.3%, a difference of 0.29%), and Immigrants from Australia (2.3%, a difference of 0.35%).
| Demographics | Rating | Rank | Self-Care Disability |
| Turks | 100.0 /100 | #25 | Exceptional 2.2% |
| Immigrants from Sri Lanka | 99.9 /100 | #26 | Exceptional 2.2% |
| Venezuelans | 99.9 /100 | #27 | Exceptional 2.2% |
| Inupiat | 99.9 /100 | #28 | Exceptional 2.2% |
| Immigrants from Zimbabwe | 99.9 /100 | #29 | Exceptional 2.3% |
| Paraguayans | 99.9 /100 | #30 | Exceptional 2.3% |
| Danes | 99.9 /100 | #31 | Exceptional 2.3% |
| Burmese | 99.9 /100 | #32 | Exceptional 2.3% |
| Immigrants from Korea | 99.9 /100 | #33 | Exceptional 2.3% |
| Immigrants from Turkey | 99.9 /100 | #34 | Exceptional 2.3% |
| Immigrants from Australia | 99.9 /100 | #35 | Exceptional 2.3% |
| Immigrants from Lithuania | 99.9 /100 | #36 | Exceptional 2.3% |
| Immigrants from Sweden | 99.9 /100 | #37 | Exceptional 2.3% |
| Immigrants from Eastern Africa | 99.9 /100 | #38 | Exceptional 2.3% |
| Immigrants from Bulgaria | 99.8 /100 | #39 | Exceptional 2.3% |
Burmese Self-Care Disability Correlation Summary
| Measurement | Burmese Data | Self-Care Disability Data |
| Minimum | 0.15% | 0.68% |
| Maximum | 53.9% | 9.0% |
| Range | 53.7% | 8.3% |
| Mean | 13.3% | 2.3% |
| Median | 11.3% | 2.1% |
| Interquartile 25% (IQ1) | 5.6% | 1.9% |
| Interquartile 75% (IQ3) | 17.5% | 2.4% |
| Interquartile Range (IQR) | 11.9% | 0.51% |
| Standard Deviation (Sample) | 10.5% | 1.1% |
| Standard Deviation (Population) | 10.4% | 1.1% |
Correlation Details
| Burmese Percentile | Sample Size | Self-Care Disability |
[ 0.0% - 0.5% ] 0.15% | 193,507,069 | 2.7% |
[ 0.0% - 0.5% ] 0.45% | 110,865,808 | 2.4% |
[ 0.5% - 1.0% ] 0.76% | 52,416,671 | 2.2% |
[ 1.0% - 1.5% ] 1.07% | 34,973,701 | 2.4% |
[ 1.0% - 1.5% ] 1.39% | 17,621,310 | 2.1% |
[ 1.5% - 2.0% ] 1.70% | 13,728,114 | 2.1% |
[ 2.0% - 2.5% ] 2.02% | 8,484,811 | 1.9% |
[ 2.0% - 2.5% ] 2.32% | 5,467,849 | 2.0% |
[ 2.5% - 3.0% ] 2.63% | 3,851,605 | 2.1% |
[ 2.5% - 3.0% ] 2.94% | 7,171,800 | 2.6% |
[ 3.0% - 3.5% ] 3.28% | 2,329,216 | 2.3% |
[ 3.5% - 4.0% ] 3.60% | 1,784,676 | 1.9% |
[ 3.5% - 4.0% ] 3.89% | 1,531,225 | 2.7% |
[ 4.0% - 4.5% ] 4.20% | 1,242,650 | 2.0% |
[ 4.5% - 5.0% ] 4.50% | 1,056,111 | 2.1% |
[ 4.5% - 5.0% ] 4.83% | 646,882 | 2.3% |
[ 5.0% - 5.5% ] 5.17% | 970,515 | 1.9% |
[ 5.0% - 5.5% ] 5.43% | 802,642 | 2.3% |
[ 5.5% - 6.0% ] 5.74% | 306,909 | 2.0% |
[ 6.0% - 6.5% ] 6.11% | 788,571 | 2.2% |
[ 6.0% - 6.5% ] 6.37% | 337,480 | 2.5% |
[ 6.5% - 7.0% ] 6.73% | 240,479 | 2.0% |
[ 6.5% - 7.0% ] 6.99% | 239,015 | 1.8% |
[ 7.0% - 7.5% ] 7.38% | 247,701 | 2.1% |
[ 7.5% - 8.0% ] 7.66% | 125,633 | 2.1% |
[ 7.5% - 8.0% ] 7.87% | 476,111 | 1.8% |
[ 8.0% - 8.5% ] 8.33% | 94,466 | 2.2% |
[ 8.5% - 9.0% ] 8.61% | 135,055 | 2.5% |
[ 8.5% - 9.0% ] 8.87% | 265,002 | 2.2% |
[ 9.0% - 9.5% ] 9.19% | 100,289 | 2.6% |
[ 9.5% - 10.0% ] 9.52% | 145,508 | 1.8% |
[ 9.5% - 10.0% ] 9.75% | 132,937 | 1.9% |
[ 10.0% - 10.5% ] 10.11% | 119,966 | 1.8% |
[ 10.0% - 10.5% ] 10.50% | 30,641 | 1.5% |
[ 10.5% - 11.0% ] 10.77% | 211,710 | 1.8% |
[ 11.0% - 11.5% ] 11.03% | 282,578 | 1.9% |
[ 11.0% - 11.5% ] 11.27% | 42,228 | 2.6% |
[ 11.5% - 12.0% ] 11.58% | 59,410 | 2.4% |
[ 11.5% - 12.0% ] 11.85% | 51,367 | 2.1% |
[ 12.0% - 12.5% ] 12.24% | 22,339 | 1.4% |
[ 12.5% - 13.0% ] 12.68% | 258,950 | 2.3% |
[ 13.0% - 13.5% ] 13.04% | 49,955 | 2.6% |
[ 13.0% - 13.5% ] 13.19% | 230,319 | 2.4% |
[ 13.5% - 14.0% ] 13.57% | 72,955 | 2.5% |
[ 13.5% - 14.0% ] 13.81% | 94,420 | 2.3% |
[ 14.0% - 14.5% ] 14.13% | 92 | 6.2% |
[ 14.0% - 14.5% ] 14.44% | 22,723 | 2.3% |
[ 14.5% - 15.0% ] 14.80% | 152,726 | 2.3% |
[ 15.0% - 15.5% ] 15.04% | 50,419 | 1.5% |
[ 15.0% - 15.5% ] 15.28% | 746 | 2.4% |
[ 15.5% - 16.0% ] 15.71% | 25,926 | 1.8% |
[ 16.0% - 16.5% ] 16.02% | 24,044 | 1.0% |
[ 16.0% - 16.5% ] 16.41% | 20,578 | 3.6% |
[ 16.5% - 17.0% ] 16.79% | 32,737 | 2.8% |
[ 17.0% - 17.5% ] 17.38% | 30,598 | 1.5% |
[ 17.5% - 18.0% ] 17.58% | 5,552 | 1.9% |
[ 19.5% - 20.0% ] 19.71% | 10,694 | 1.7% |
[ 20.0% - 20.5% ] 20.45% | 28,984 | 1.1% |
[ 21.0% - 21.5% ] 21.01% | 39,049 | 2.3% |
[ 23.0% - 23.5% ] 23.22% | 23,546 | 2.4% |
[ 23.0% - 23.5% ] 23.48% | 133,518 | 2.9% |
[ 23.5% - 24.0% ] 23.80% | 22,930 | 2.3% |
[ 24.5% - 25.0% ] 24.51% | 17,110 | 2.0% |
[ 24.5% - 25.0% ] 24.71% | 37,754 | 2.1% |
[ 25.5% - 26.0% ] 25.72% | 43,169 | 1.7% |
[ 26.0% - 26.5% ] 26.48% | 321 | 4.7% |
[ 27.0% - 27.5% ] 27.03% | 111 | 9.0% |
[ 27.0% - 27.5% ] 27.19% | 18,564 | 2.2% |
[ 27.0% - 27.5% ] 27.45% | 11,314 | 2.1% |
[ 31.5% - 32.0% ] 31.55% | 5,863 | 0.68% |
[ 37.5% - 38.0% ] 37.60% | 125 | 2.2% |
[ 46.0% - 46.5% ] 46.33% | 4,185 | 1.5% |
[ 53.5% - 54.0% ] 53.89% | 40,462 | 1.5% |