Burmese vs Immigrants from Italy Married-Couple Family Poverty
COMPARE
Burmese
Immigrants from Italy
Married-Couple Family Poverty
Married-Couple Family Poverty Comparison
Burmese
Immigrants from Italy
4.3%
MARRIED-COUPLE FAMILY POVERTY
99.7/ 100
METRIC RATING
50th/ 347
METRIC RANK
4.6%
MARRIED-COUPLE FAMILY POVERTY
98.3/ 100
METRIC RATING
94th/ 347
METRIC RANK
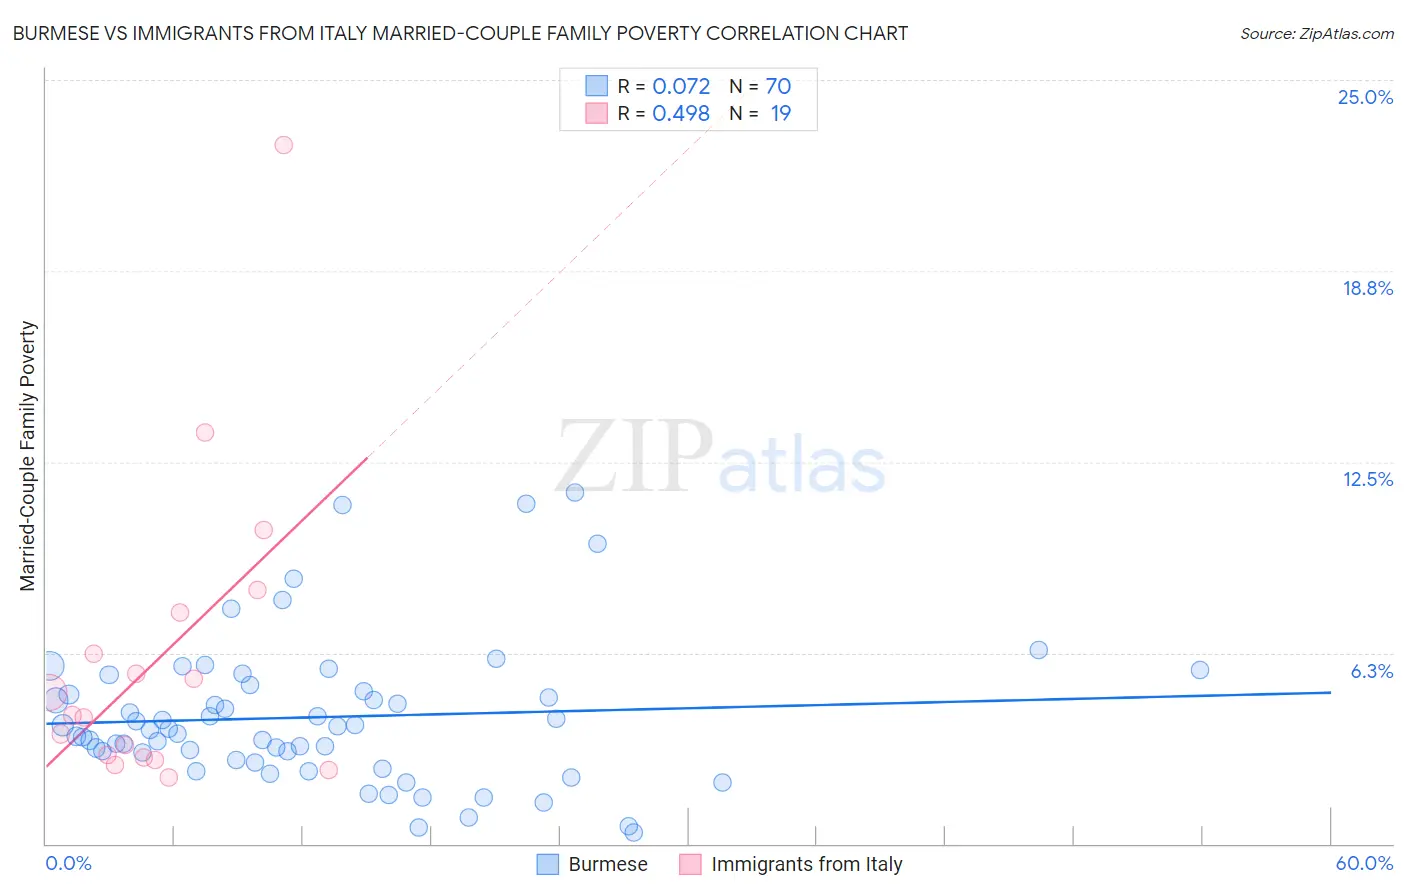
Burmese vs Immigrants from Italy Married-Couple Family Poverty Correlation Chart
The statistical analysis conducted on geographies consisting of 459,334,774 people shows a slight positive correlation between the proportion of Burmese and poverty level among married-couple families in the United States with a correlation coefficient (R) of 0.072 and weighted average of 4.3%. Similarly, the statistical analysis conducted on geographies consisting of 321,486,465 people shows a moderate positive correlation between the proportion of Immigrants from Italy and poverty level among married-couple families in the United States with a correlation coefficient (R) of 0.498 and weighted average of 4.6%, a difference of 6.6%.
Married-Couple Family Poverty Correlation Summary
| Measurement | Burmese | Immigrants from Italy |
| Minimum | 0.39% | 2.2% |
| Maximum | 11.5% | 22.9% |
| Range | 11.1% | 20.7% |
| Mean | 4.1% | 6.1% |
| Median | 3.8% | 4.2% |
| Interquartile 25% (IQ1) | 2.8% | 2.8% |
| Interquartile 75% (IQ3) | 5.0% | 7.6% |
| Interquartile Range (IQR) | 2.2% | 4.7% |
| Standard Deviation (Sample) | 2.4% | 5.0% |
| Standard Deviation (Population) | 2.4% | 4.9% |
Similar Demographics by Married-Couple Family Poverty
Demographics Similar to Burmese by Married-Couple Family Poverty
In terms of married-couple family poverty, the demographic groups most similar to Burmese are Immigrants from Lithuania (4.3%, a difference of 0.010%), Russian (4.3%, a difference of 0.040%), Turkish (4.3%, a difference of 0.10%), Australian (4.3%, a difference of 0.18%), and Welsh (4.3%, a difference of 0.19%).
| Demographics | Rating | Rank | Married-Couple Family Poverty |
| Swiss | 99.8 /100 | #43 | Exceptional 4.3% |
| Immigrants | Japan | 99.8 /100 | #44 | Exceptional 4.3% |
| Serbians | 99.8 /100 | #45 | Exceptional 4.3% |
| British | 99.8 /100 | #46 | Exceptional 4.3% |
| Immigrants | South Central Asia | 99.8 /100 | #47 | Exceptional 4.3% |
| Australians | 99.7 /100 | #48 | Exceptional 4.3% |
| Turks | 99.7 /100 | #49 | Exceptional 4.3% |
| Burmese | 99.7 /100 | #50 | Exceptional 4.3% |
| Immigrants | Lithuania | 99.7 /100 | #51 | Exceptional 4.3% |
| Russians | 99.7 /100 | #52 | Exceptional 4.3% |
| Welsh | 99.7 /100 | #53 | Exceptional 4.3% |
| Austrians | 99.7 /100 | #54 | Exceptional 4.3% |
| French | 99.7 /100 | #55 | Exceptional 4.3% |
| Immigrants | Zimbabwe | 99.7 /100 | #56 | Exceptional 4.3% |
| Immigrants | Netherlands | 99.7 /100 | #57 | Exceptional 4.3% |
Demographics Similar to Immigrants from Italy by Married-Couple Family Poverty
In terms of married-couple family poverty, the demographic groups most similar to Immigrants from Italy are Portuguese (4.6%, a difference of 0.040%), Korean (4.6%, a difference of 0.050%), Immigrants from Poland (4.6%, a difference of 0.12%), Immigrants from Belgium (4.6%, a difference of 0.17%), and Immigrants from Norway (4.6%, a difference of 0.23%).
| Demographics | Rating | Rank | Married-Couple Family Poverty |
| Immigrants | North Macedonia | 98.6 /100 | #87 | Exceptional 4.6% |
| Bolivians | 98.6 /100 | #88 | Exceptional 4.6% |
| Immigrants | Czechoslovakia | 98.5 /100 | #89 | Exceptional 4.6% |
| Immigrants | Switzerland | 98.5 /100 | #90 | Exceptional 4.6% |
| Basques | 98.5 /100 | #91 | Exceptional 4.6% |
| Immigrants | Norway | 98.4 /100 | #92 | Exceptional 4.6% |
| Koreans | 98.3 /100 | #93 | Exceptional 4.6% |
| Immigrants | Italy | 98.3 /100 | #94 | Exceptional 4.6% |
| Portuguese | 98.3 /100 | #95 | Exceptional 4.6% |
| Immigrants | Poland | 98.3 /100 | #96 | Exceptional 4.6% |
| Immigrants | Belgium | 98.2 /100 | #97 | Exceptional 4.6% |
| Native Hawaiians | 98.0 /100 | #98 | Exceptional 4.6% |
| Immigrants | Europe | 97.9 /100 | #99 | Exceptional 4.6% |
| Immigrants | Western Europe | 97.9 /100 | #100 | Exceptional 4.6% |
| Yugoslavians | 97.8 /100 | #101 | Exceptional 4.6% |