British 4 or more Vehicles in Household
COMPARE
British
Select to Compare
4 or more Vehicles in Household
British 4 or more Vehicles in Household
7.2%
4+ VEHICLES AVAILABLE
99.6/ 100
METRIC RATING
89th/ 347
METRIC RANK
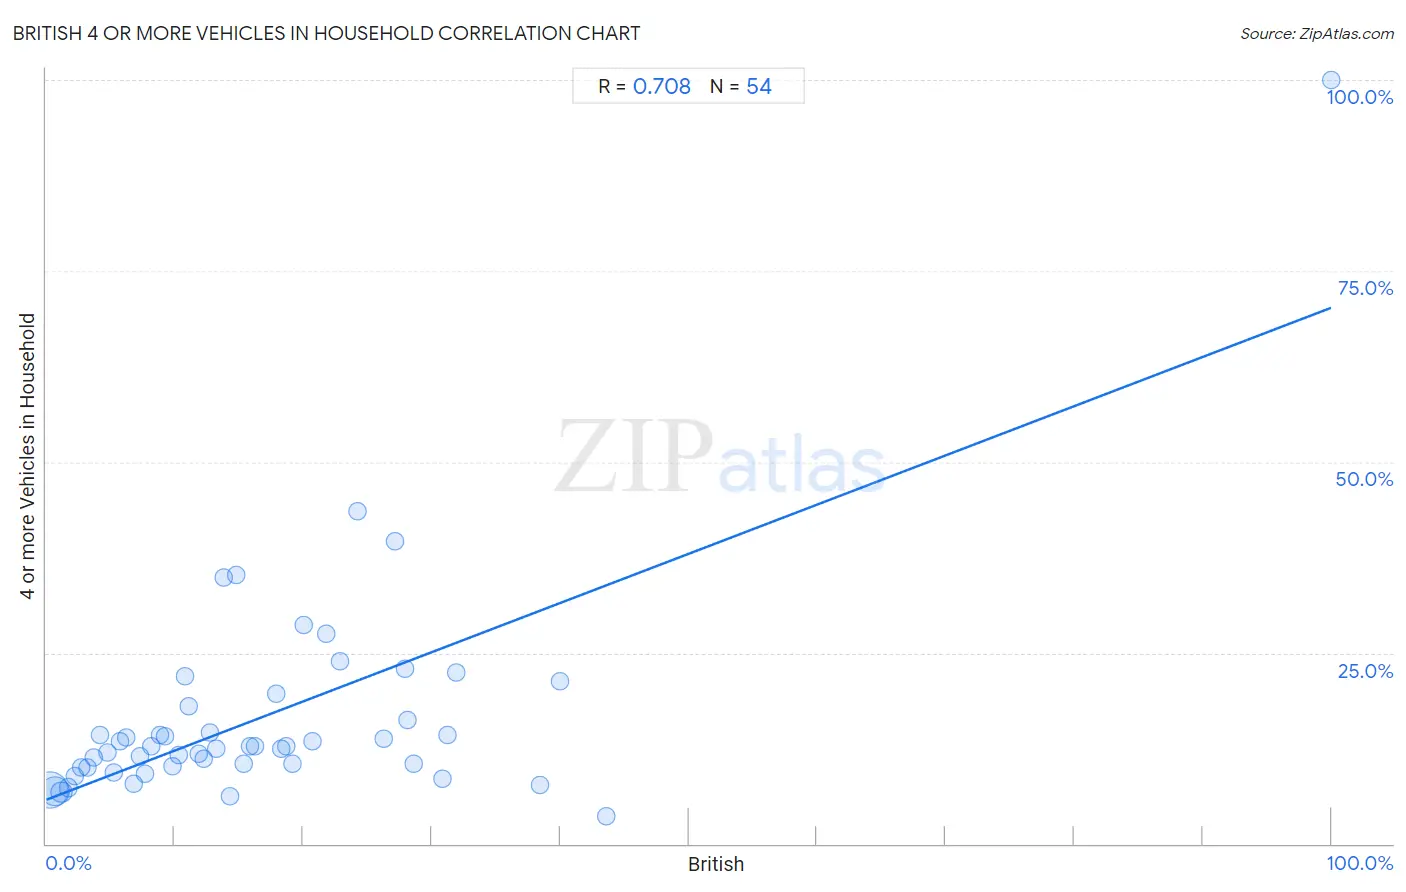
British 4 or more Vehicles in Household Correlation Chart
The statistical analysis conducted on geographies consisting of 528,748,745 people shows a strong positive correlation between the proportion of British and percentage of households with 4 or more vehicles available in the United States with a correlation coefficient (R) of 0.708 and weighted average of 7.2%. On average, for every 1% (one percent) increase in British within a typical geography, there is an increase of 0.64% in percentage of households with 4 or more vehicles available.
It is essential to understand that the correlation between the percentage of British and percentage of households with 4 or more vehicles available does not imply a direct cause-and-effect relationship. It remains uncertain whether the presence of British influences an upward or downward trend in the level of percentage of households with 4 or more vehicles available within an area, or if British simply ended up residing in those areas with higher or lower levels of percentage of households with 4 or more vehicles available due to other factors.
Demographics Similar to British by 4 or more Vehicles in Household
In terms of 4 or more vehicles in household, the demographic groups most similar to British are Creek (7.2%, a difference of 0.080%), Nonimmigrants (7.2%, a difference of 0.33%), Delaware (7.2%, a difference of 0.35%), Immigrants from Indonesia (7.2%, a difference of 0.41%), and Cree (7.2%, a difference of 0.59%).
| Demographics | Rating | Rank | 4 or more Vehicles in Household |
| Northern Europeans | 99.8 /100 | #82 | Exceptional 7.3% |
| Potawatomi | 99.7 /100 | #83 | Exceptional 7.3% |
| Afghans | 99.7 /100 | #84 | Exceptional 7.3% |
| Cree | 99.7 /100 | #85 | Exceptional 7.2% |
| Immigrants from Indonesia | 99.6 /100 | #86 | Exceptional 7.2% |
| Delaware | 99.6 /100 | #87 | Exceptional 7.2% |
| Nonimmigrants | 99.6 /100 | #88 | Exceptional 7.2% |
| British | 99.6 /100 | #89 | Exceptional 7.2% |
| Creek | 99.6 /100 | #90 | Exceptional 7.2% |
| Assyrians/Chaldeans/Syriacs | 99.4 /100 | #91 | Exceptional 7.2% |
| Immigrants from Latin America | 99.4 /100 | #92 | Exceptional 7.1% |
| Immigrants from Afghanistan | 99.3 /100 | #93 | Exceptional 7.1% |
| Dutch West Indians | 99.3 /100 | #94 | Exceptional 7.1% |
| Czechoslovakians | 99.3 /100 | #95 | Exceptional 7.1% |
| Central Americans | 99.3 /100 | #96 | Exceptional 7.1% |
British 4 or more Vehicles in Household Correlation Summary
| Measurement | British Data | 4 or more Vehicles in Household Data |
| Minimum | 0.26% | 3.5% |
| Maximum | 100.0% | 100.0% |
| Range | 99.7% | 96.5% |
| Mean | 16.9% | 16.6% |
| Median | 13.5% | 12.7% |
| Interquartile 25% (IQ1) | 6.8% | 10.0% |
| Interquartile 75% (IQ3) | 22.8% | 18.0% |
| Interquartile Range (IQR) | 16.1% | 8.0% |
| Standard Deviation (Sample) | 15.8% | 14.4% |
| Standard Deviation (Population) | 15.6% | 14.2% |
Correlation Details
| British Percentile | Sample Size | 4 or more Vehicles in Household |
[ 0.0% - 0.5% ] 0.26% | 284,421,058 | 7.0% |
[ 0.5% - 1.0% ] 0.71% | 171,633,791 | 6.8% |
[ 1.0% - 1.5% ] 1.20% | 49,499,092 | 6.7% |
[ 1.5% - 2.0% ] 1.70% | 13,858,852 | 7.4% |
[ 2.0% - 2.5% ] 2.22% | 4,920,635 | 8.8% |
[ 2.5% - 3.0% ] 2.73% | 2,055,396 | 10.0% |
[ 3.0% - 3.5% ] 3.23% | 788,112 | 10.0% |
[ 3.5% - 4.0% ] 3.74% | 631,768 | 11.2% |
[ 4.0% - 4.5% ] 4.19% | 357,462 | 14.3% |
[ 4.5% - 5.0% ] 4.73% | 145,869 | 11.9% |
[ 5.0% - 5.5% ] 5.30% | 78,188 | 9.3% |
[ 5.5% - 6.0% ] 5.79% | 54,315 | 13.5% |
[ 6.0% - 6.5% ] 6.22% | 49,253 | 14.0% |
[ 6.5% - 7.0% ] 6.77% | 47,456 | 7.8% |
[ 7.0% - 7.5% ] 7.26% | 45,428 | 11.5% |
[ 7.5% - 8.0% ] 7.73% | 33,947 | 9.2% |
[ 8.0% - 8.5% ] 8.19% | 37,008 | 12.7% |
[ 8.5% - 9.0% ] 8.84% | 18,757 | 14.3% |
[ 9.0% - 9.5% ] 9.27% | 9,827 | 14.1% |
[ 9.5% - 10.0% ] 9.79% | 4,361 | 10.1% |
[ 10.0% - 10.5% ] 10.28% | 13,391 | 11.7% |
[ 10.5% - 11.0% ] 10.83% | 8,845 | 22.0% |
[ 11.0% - 11.5% ] 11.11% | 1,368 | 18.0% |
[ 11.5% - 12.0% ] 11.85% | 4,978 | 11.8% |
[ 12.0% - 12.5% ] 12.28% | 2,939 | 11.0% |
[ 12.5% - 13.0% ] 12.73% | 2,490 | 14.6% |
[ 13.0% - 13.5% ] 13.22% | 4,426 | 12.5% |
[ 13.5% - 14.0% ] 13.83% | 1,005 | 34.8% |
[ 14.0% - 14.5% ] 14.29% | 2,912 | 6.2% |
[ 14.5% - 15.0% ] 14.77% | 440 | 35.2% |
[ 15.0% - 15.5% ] 15.33% | 548 | 10.5% |
[ 15.5% - 16.0% ] 15.84% | 3,371 | 12.8% |
[ 16.0% - 16.5% ] 16.24% | 3,349 | 12.7% |
[ 17.5% - 18.0% ] 17.86% | 532 | 19.6% |
[ 18.0% - 18.5% ] 18.30% | 716 | 12.4% |
[ 18.5% - 19.0% ] 18.69% | 883 | 12.8% |
[ 19.0% - 19.5% ] 19.14% | 1,599 | 10.5% |
[ 20.0% - 20.5% ] 20.00% | 15 | 28.6% |
[ 20.5% - 21.0% ] 20.76% | 342 | 13.4% |
[ 21.5% - 22.0% ] 21.83% | 339 | 27.5% |
[ 22.5% - 23.0% ] 22.84% | 324 | 23.8% |
[ 24.0% - 24.5% ] 24.22% | 128 | 43.5% |
[ 26.0% - 26.5% ] 26.24% | 282 | 13.8% |
[ 27.0% - 27.5% ] 27.16% | 243 | 39.6% |
[ 27.5% - 28.0% ] 27.92% | 745 | 22.9% |
[ 28.0% - 28.5% ] 28.12% | 96 | 16.2% |
[ 28.5% - 29.0% ] 28.57% | 28 | 10.5% |
[ 30.5% - 31.0% ] 30.81% | 185 | 8.6% |
[ 31.0% - 31.5% ] 31.20% | 125 | 14.3% |
[ 31.5% - 32.0% ] 31.89% | 1,063 | 22.4% |
[ 38.0% - 38.5% ] 38.46% | 39 | 7.7% |
[ 40.0% - 40.5% ] 40.00% | 135 | 21.3% |
[ 43.5% - 44.0% ] 43.55% | 287 | 3.5% |
[ 99.5% - 100.0% ] 100.00% | 2 | 100.0% |