British Self-Care Disability
COMPARE
British
Select to Compare
Self-Care Disability
British Self-Care Disability
2.4%
SELF-CARE DISABILITY
94.3/ 100
METRIC RATING
107th/ 347
METRIC RANK
British Self-Care Disability Correlation Chart
The statistical analysis conducted on geographies consisting of 530,052,811 people shows a significant positive correlation between the proportion of British and percentage of population with self-care disability in the United States with a correlation coefficient (R) of 0.688 and weighted average of 2.4%. On average, for every 1% (one percent) increase in British within a typical geography, there is an increase of 0.67% in percentage of population with self-care disability.
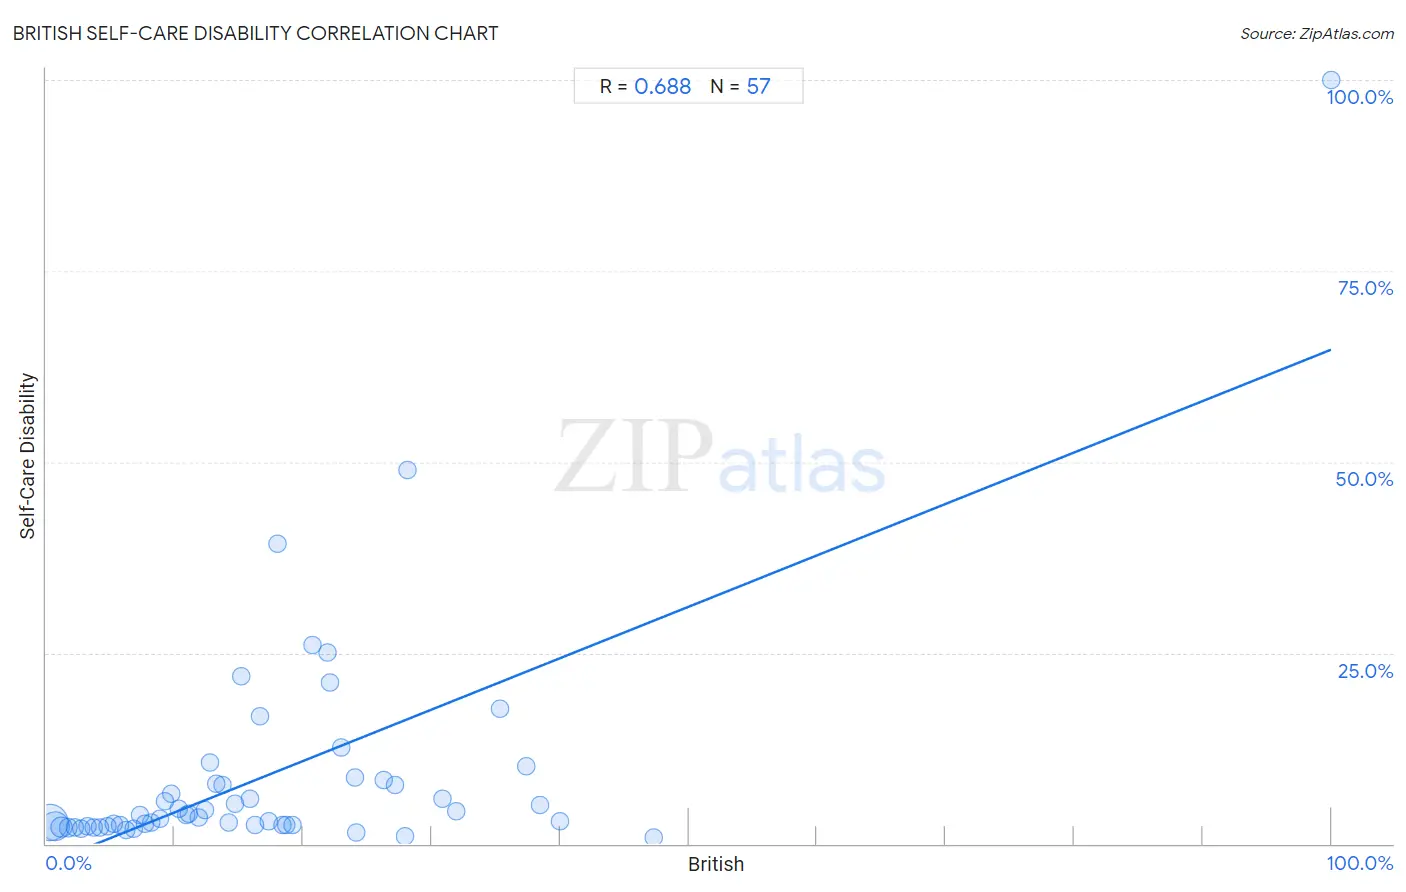
It is essential to understand that the correlation between the percentage of British and percentage of population with self-care disability does not imply a direct cause-and-effect relationship. It remains uncertain whether the presence of British influences an upward or downward trend in the level of percentage of population with self-care disability within an area, or if British simply ended up residing in those areas with higher or lower levels of percentage of population with self-care disability due to other factors.
Demographics Similar to British by Self-Care Disability
In terms of self-care disability, the demographic groups most similar to British are Immigrants from Indonesia (2.4%, a difference of 0.010%), Carpatho Rusyn (2.4%, a difference of 0.020%), Greek (2.4%, a difference of 0.030%), Slovene (2.4%, a difference of 0.040%), and Bhutanese (2.4%, a difference of 0.050%).
| Demographics | Rating | Rank | Self-Care Disability |
| Europeans | 95.8 /100 | #100 | Exceptional 2.4% |
| Immigrants from Scotland | 95.7 /100 | #101 | Exceptional 2.4% |
| Croatians | 95.0 /100 | #102 | Exceptional 2.4% |
| Alsatians | 94.9 /100 | #103 | Exceptional 2.4% |
| Bhutanese | 94.5 /100 | #104 | Exceptional 2.4% |
| Carpatho Rusyns | 94.4 /100 | #105 | Exceptional 2.4% |
| Immigrants from Indonesia | 94.3 /100 | #106 | Exceptional 2.4% |
| British | 94.3 /100 | #107 | Exceptional 2.4% |
| Greeks | 94.1 /100 | #108 | Exceptional 2.4% |
| Slovenes | 94.1 /100 | #109 | Exceptional 2.4% |
| Immigrants from Africa | 93.7 /100 | #110 | Exceptional 2.4% |
| Serbians | 93.6 /100 | #111 | Exceptional 2.4% |
| Scandinavians | 93.5 /100 | #112 | Exceptional 2.4% |
| South Americans | 93.2 /100 | #113 | Exceptional 2.4% |
| Immigrants from North Macedonia | 93.1 /100 | #114 | Exceptional 2.4% |
British Self-Care Disability Correlation Summary
| Measurement | British Data | Self-Care Disability Data |
| Minimum | 0.26% | 0.87% |
| Maximum | 100.0% | 100.0% |
| Range | 99.7% | 99.1% |
| Mean | 17.3% | 9.0% |
| Median | 14.2% | 3.7% |
| Interquartile 25% (IQ1) | 7.0% | 2.4% |
| Interquartile 75% (IQ3) | 23.5% | 8.0% |
| Interquartile Range (IQR) | 16.5% | 5.6% |
| Standard Deviation (Sample) | 15.7% | 15.4% |
| Standard Deviation (Population) | 15.6% | 15.3% |
Correlation Details
| British Percentile | Sample Size | Self-Care Disability |
[ 0.0% - 0.5% ] 0.26% | 285,220,580 | 2.8% |
[ 0.5% - 1.0% ] 0.71% | 171,968,802 | 2.3% |
[ 1.0% - 1.5% ] 1.20% | 49,688,060 | 2.2% |
[ 1.5% - 2.0% ] 1.70% | 13,904,956 | 2.1% |
[ 2.0% - 2.5% ] 2.22% | 4,919,804 | 2.1% |
[ 2.5% - 3.0% ] 2.73% | 2,051,217 | 2.0% |
[ 3.0% - 3.5% ] 3.23% | 771,037 | 2.3% |
[ 3.5% - 4.0% ] 3.74% | 625,125 | 2.2% |
[ 4.0% - 4.5% ] 4.19% | 346,832 | 2.2% |
[ 4.5% - 5.0% ] 4.73% | 140,907 | 2.4% |
[ 5.0% - 5.5% ] 5.30% | 74,839 | 2.6% |
[ 5.5% - 6.0% ] 5.78% | 53,634 | 2.4% |
[ 6.0% - 6.5% ] 6.22% | 43,607 | 1.8% |
[ 6.5% - 7.0% ] 6.78% | 45,736 | 1.9% |
[ 7.0% - 7.5% ] 7.26% | 42,858 | 3.8% |
[ 7.5% - 8.0% ] 7.72% | 33,527 | 2.6% |
[ 8.0% - 8.5% ] 8.19% | 38,149 | 2.7% |
[ 8.5% - 9.0% ] 8.85% | 19,530 | 3.3% |
[ 9.0% - 9.5% ] 9.24% | 7,649 | 5.6% |
[ 9.5% - 10.0% ] 9.72% | 5,709 | 6.6% |
[ 10.0% - 10.5% ] 10.28% | 10,693 | 4.6% |
[ 10.5% - 11.0% ] 10.87% | 5,390 | 3.7% |
[ 11.0% - 11.5% ] 11.09% | 2,497 | 3.9% |
[ 11.5% - 12.0% ] 11.84% | 3,977 | 3.5% |
[ 12.0% - 12.5% ] 12.31% | 2,566 | 4.5% |
[ 12.5% - 13.0% ] 12.71% | 645 | 10.6% |
[ 13.0% - 13.5% ] 13.22% | 4,441 | 7.8% |
[ 13.5% - 14.0% ] 13.71% | 722 | 7.8% |
[ 14.0% - 14.5% ] 14.23% | 3,943 | 2.7% |
[ 14.5% - 15.0% ] 14.68% | 545 | 5.3% |
[ 15.0% - 15.5% ] 15.18% | 224 | 21.9% |
[ 15.5% - 16.0% ] 15.85% | 3,010 | 5.9% |
[ 16.0% - 16.5% ] 16.25% | 4,702 | 2.4% |
[ 16.5% - 17.0% ] 16.67% | 12 | 16.7% |
[ 17.0% - 17.5% ] 17.29% | 133 | 3.0% |
[ 17.5% - 18.0% ] 17.98% | 89 | 39.3% |
[ 18.0% - 18.5% ] 18.35% | 812 | 2.5% |
[ 18.5% - 19.0% ] 18.70% | 679 | 2.4% |
[ 19.0% - 19.5% ] 19.13% | 1,474 | 2.5% |
[ 20.5% - 21.0% ] 20.76% | 342 | 26.0% |
[ 21.5% - 22.0% ] 21.88% | 32 | 25.0% |
[ 22.0% - 22.5% ] 22.12% | 208 | 21.2% |
[ 22.5% - 23.0% ] 22.99% | 87 | 12.6% |
[ 24.0% - 24.5% ] 24.00% | 25 | 8.7% |
[ 24.0% - 24.5% ] 24.09% | 137 | 1.5% |
[ 26.0% - 26.5% ] 26.24% | 282 | 8.3% |
[ 27.0% - 27.5% ] 27.16% | 243 | 7.6% |
[ 27.5% - 28.0% ] 27.93% | 290 | 1.1% |
[ 28.0% - 28.5% ] 28.12% | 96 | 49.0% |
[ 30.5% - 31.0% ] 30.81% | 185 | 5.9% |
[ 31.5% - 32.0% ] 31.89% | 1,063 | 4.3% |
[ 35.0% - 35.5% ] 35.29% | 51 | 17.6% |
[ 37.0% - 37.5% ] 37.37% | 99 | 10.1% |
[ 38.0% - 38.5% ] 38.46% | 39 | 5.1% |
[ 40.0% - 40.5% ] 40.00% | 135 | 3.0% |
[ 47.0% - 47.5% ] 47.26% | 347 | 0.87% |
[ 99.5% - 100.0% ] 100.00% | 38 | 100.0% |