British 3 or more Vehicles in Household
COMPARE
British
Select to Compare
3 or more Vehicles in Household
British 3 or more Vehicles in Household
21.9%
3+ VEHICLES AVAILABLE
99.9/ 100
METRIC RATING
68th/ 347
METRIC RANK
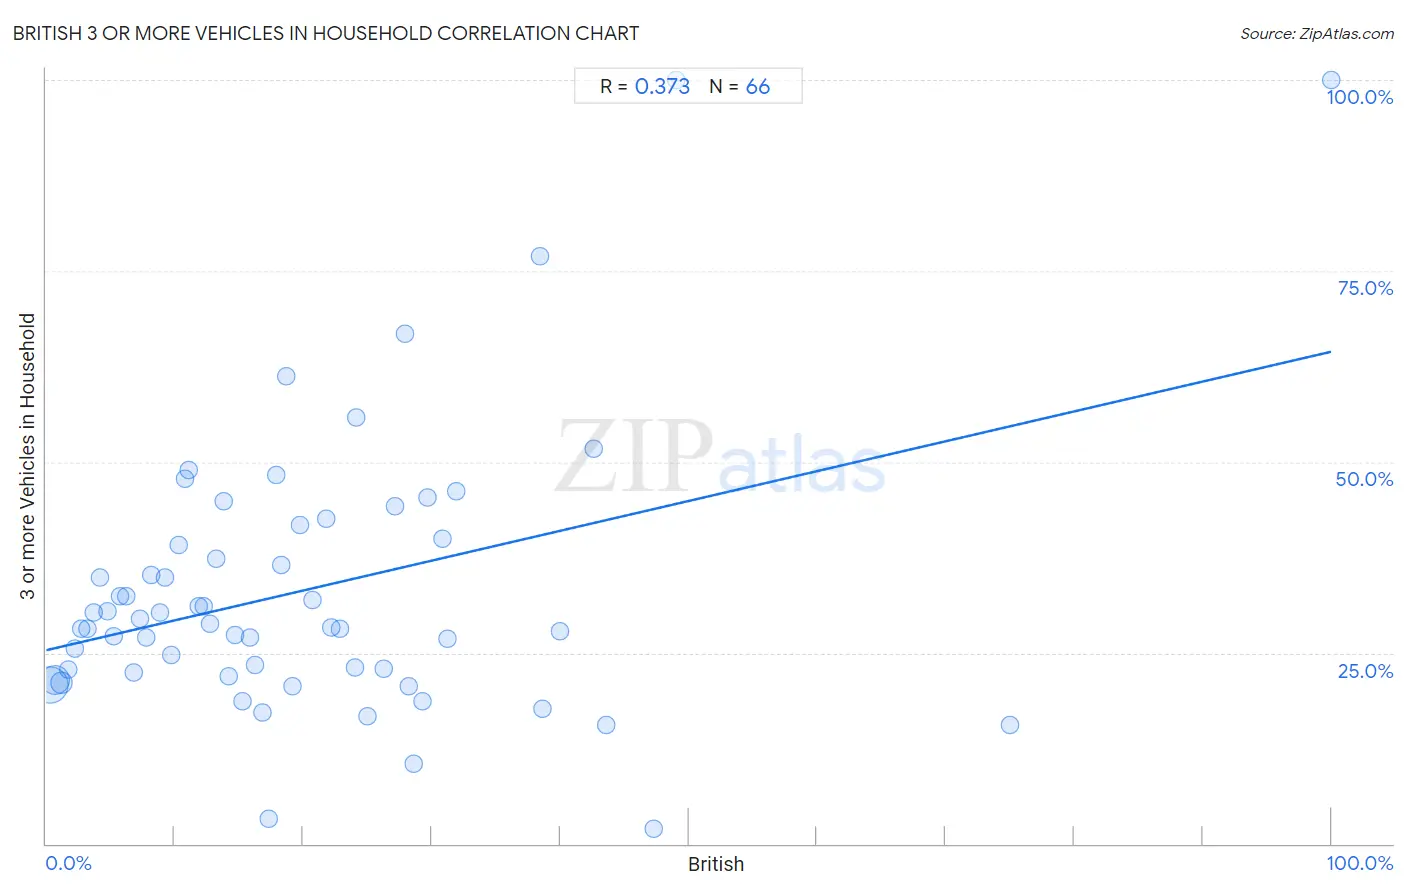
British 3 or more Vehicles in Household Correlation Chart
The statistical analysis conducted on geographies consisting of 530,803,931 people shows a mild positive correlation between the proportion of British and percentage of households with 3 or more vehicles available in the United States with a correlation coefficient (R) of 0.373 and weighted average of 21.9%. On average, for every 1% (one percent) increase in British within a typical geography, there is an increase of 0.39% in percentage of households with 3 or more vehicles available.
It is essential to understand that the correlation between the percentage of British and percentage of households with 3 or more vehicles available does not imply a direct cause-and-effect relationship. It remains uncertain whether the presence of British influences an upward or downward trend in the level of percentage of households with 3 or more vehicles available within an area, or if British simply ended up residing in those areas with higher or lower levels of percentage of households with 3 or more vehicles available due to other factors.
Demographics Similar to British by 3 or more Vehicles in Household
In terms of 3 or more vehicles in household, the demographic groups most similar to British are Creek (21.9%, a difference of 0.030%), Alaskan Athabascan (21.9%, a difference of 0.15%), Bangladeshi (21.9%, a difference of 0.22%), Potawatomi (21.9%, a difference of 0.23%), and Northern European (22.0%, a difference of 0.41%).
| Demographics | Rating | Rank | 3 or more Vehicles in Household |
| Bhutanese | 99.9 /100 | #61 | Exceptional 22.2% |
| Fijians | 99.9 /100 | #62 | Exceptional 22.2% |
| Chickasaw | 99.9 /100 | #63 | Exceptional 22.2% |
| Immigrants from Taiwan | 99.9 /100 | #64 | Exceptional 22.1% |
| Pima | 99.9 /100 | #65 | Exceptional 22.0% |
| Northern Europeans | 99.9 /100 | #66 | Exceptional 22.0% |
| Alaskan Athabascans | 99.9 /100 | #67 | Exceptional 21.9% |
| British | 99.9 /100 | #68 | Exceptional 21.9% |
| Creek | 99.9 /100 | #69 | Exceptional 21.9% |
| Bangladeshis | 99.8 /100 | #70 | Exceptional 21.9% |
| Potawatomi | 99.8 /100 | #71 | Exceptional 21.9% |
| Portuguese | 99.8 /100 | #72 | Exceptional 21.8% |
| Salvadorans | 99.8 /100 | #73 | Exceptional 21.8% |
| Immigrants from Oceania | 99.8 /100 | #74 | Exceptional 21.8% |
| Japanese | 99.8 /100 | #75 | Exceptional 21.8% |
British 3 or more Vehicles in Household Correlation Summary
| Measurement | British Data | 3 or more Vehicles in Household Data |
| Minimum | 0.26% | 1.9% |
| Maximum | 100.0% | 100.0% |
| Range | 99.7% | 98.1% |
| Mean | 20.1% | 33.2% |
| Median | 16.5% | 28.6% |
| Interquartile 25% (IQ1) | 8.2% | 22.5% |
| Interquartile 75% (IQ3) | 27.9% | 40.0% |
| Interquartile Range (IQR) | 19.7% | 17.5% |
| Standard Deviation (Sample) | 17.3% | 18.1% |
| Standard Deviation (Population) | 17.2% | 18.0% |
Correlation Details
| British Percentile | Sample Size | 3 or more Vehicles in Household |
[ 0.0% - 0.5% ] 0.26% | 285,444,690 | 20.9% |
[ 0.5% - 1.0% ] 0.71% | 172,122,317 | 21.4% |
[ 1.0% - 1.5% ] 1.20% | 49,799,701 | 21.1% |
[ 1.5% - 2.0% ] 1.70% | 13,975,484 | 22.8% |
[ 2.0% - 2.5% ] 2.22% | 4,959,451 | 25.6% |
[ 2.5% - 3.0% ] 2.73% | 2,076,268 | 28.2% |
[ 3.0% - 3.5% ] 3.23% | 796,198 | 28.2% |
[ 3.5% - 4.0% ] 3.74% | 645,538 | 30.2% |
[ 4.0% - 4.5% ] 4.19% | 362,230 | 34.9% |
[ 4.5% - 5.0% ] 4.73% | 150,565 | 30.5% |
[ 5.0% - 5.5% ] 5.30% | 81,478 | 27.2% |
[ 5.5% - 6.0% ] 5.78% | 57,285 | 32.4% |
[ 6.0% - 6.5% ] 6.22% | 52,683 | 32.3% |
[ 6.5% - 7.0% ] 6.77% | 49,567 | 22.5% |
[ 7.0% - 7.5% ] 7.26% | 45,953 | 29.5% |
[ 7.5% - 8.0% ] 7.73% | 36,458 | 27.0% |
[ 8.0% - 8.5% ] 8.19% | 39,318 | 35.2% |
[ 8.5% - 9.0% ] 8.83% | 20,761 | 30.4% |
[ 9.0% - 9.5% ] 9.23% | 13,698 | 34.9% |
[ 9.5% - 10.0% ] 9.75% | 7,085 | 24.7% |
[ 10.0% - 10.5% ] 10.28% | 13,450 | 39.2% |
[ 10.5% - 11.0% ] 10.82% | 9,268 | 47.8% |
[ 11.0% - 11.5% ] 11.12% | 2,032 | 48.9% |
[ 11.5% - 12.0% ] 11.85% | 4,978 | 31.1% |
[ 12.0% - 12.5% ] 12.29% | 3,303 | 31.0% |
[ 12.5% - 13.0% ] 12.75% | 2,644 | 28.8% |
[ 13.0% - 13.5% ] 13.22% | 4,441 | 37.4% |
[ 13.5% - 14.0% ] 13.79% | 1,327 | 44.8% |
[ 14.0% - 14.5% ] 14.22% | 4,333 | 22.0% |
[ 14.5% - 15.0% ] 14.68% | 838 | 27.4% |
[ 15.0% - 15.5% ] 15.32% | 581 | 18.6% |
[ 15.5% - 16.0% ] 15.82% | 4,330 | 26.9% |
[ 16.0% - 16.5% ] 16.24% | 4,753 | 23.4% |
[ 16.5% - 17.0% ] 16.83% | 523 | 17.2% |
[ 17.0% - 17.5% ] 17.29% | 133 | 3.2% |
[ 17.5% - 18.0% ] 17.87% | 621 | 48.3% |
[ 18.0% - 18.5% ] 18.33% | 884 | 36.5% |
[ 18.5% - 19.0% ] 18.71% | 994 | 61.3% |
[ 19.0% - 19.5% ] 19.14% | 1,599 | 20.6% |
[ 19.5% - 20.0% ] 19.70% | 269 | 41.7% |
[ 20.5% - 21.0% ] 20.76% | 342 | 31.9% |
[ 21.5% - 22.0% ] 21.82% | 385 | 42.5% |
[ 22.0% - 22.5% ] 22.17% | 442 | 28.3% |
[ 22.5% - 23.0% ] 22.84% | 324 | 28.2% |
[ 24.0% - 24.5% ] 24.00% | 25 | 23.1% |
[ 24.0% - 24.5% ] 24.15% | 265 | 55.8% |
[ 25.0% - 25.5% ] 25.00% | 76 | 16.7% |
[ 26.0% - 26.5% ] 26.24% | 282 | 22.9% |
[ 27.0% - 27.5% ] 27.16% | 243 | 44.1% |
[ 27.5% - 28.0% ] 27.92% | 745 | 66.8% |
[ 28.0% - 28.5% ] 28.21% | 156 | 20.6% |
[ 28.5% - 29.0% ] 28.57% | 28 | 10.5% |
[ 29.0% - 29.5% ] 29.31% | 58 | 18.6% |
[ 29.5% - 30.0% ] 29.66% | 118 | 45.3% |
[ 30.5% - 31.0% ] 30.81% | 185 | 40.0% |
[ 31.0% - 31.5% ] 31.20% | 125 | 26.8% |
[ 31.5% - 32.0% ] 31.89% | 1,063 | 46.1% |
[ 38.0% - 38.5% ] 38.46% | 39 | 76.9% |
[ 38.5% - 39.0% ] 38.60% | 57 | 17.6% |
[ 40.0% - 40.5% ] 40.00% | 135 | 27.9% |
[ 42.5% - 43.0% ] 42.65% | 68 | 51.7% |
[ 43.5% - 44.0% ] 43.55% | 287 | 15.5% |
[ 47.0% - 47.5% ] 47.26% | 347 | 1.9% |
[ 48.5% - 49.0% ] 48.98% | 49 | 100.0% |
[ 75.0% - 75.5% ] 75.00% | 44 | 15.6% |
[ 99.5% - 100.0% ] 100.00% | 14 | 100.0% |