Bolivian Unemployment Among Women with Children Ages 6 to 17 years
COMPARE
Bolivian
Select to Compare
Unemployment Among Women with Children Ages 6 to 17 years
Bolivian Unemployment Among Women with Children Ages 6 to 17 years
8.5%
UNEMPLOYMENT | WOMEN W/ CHILDREN 6 TO 17
98.5/ 100
METRIC RATING
97th/ 347
METRIC RANK
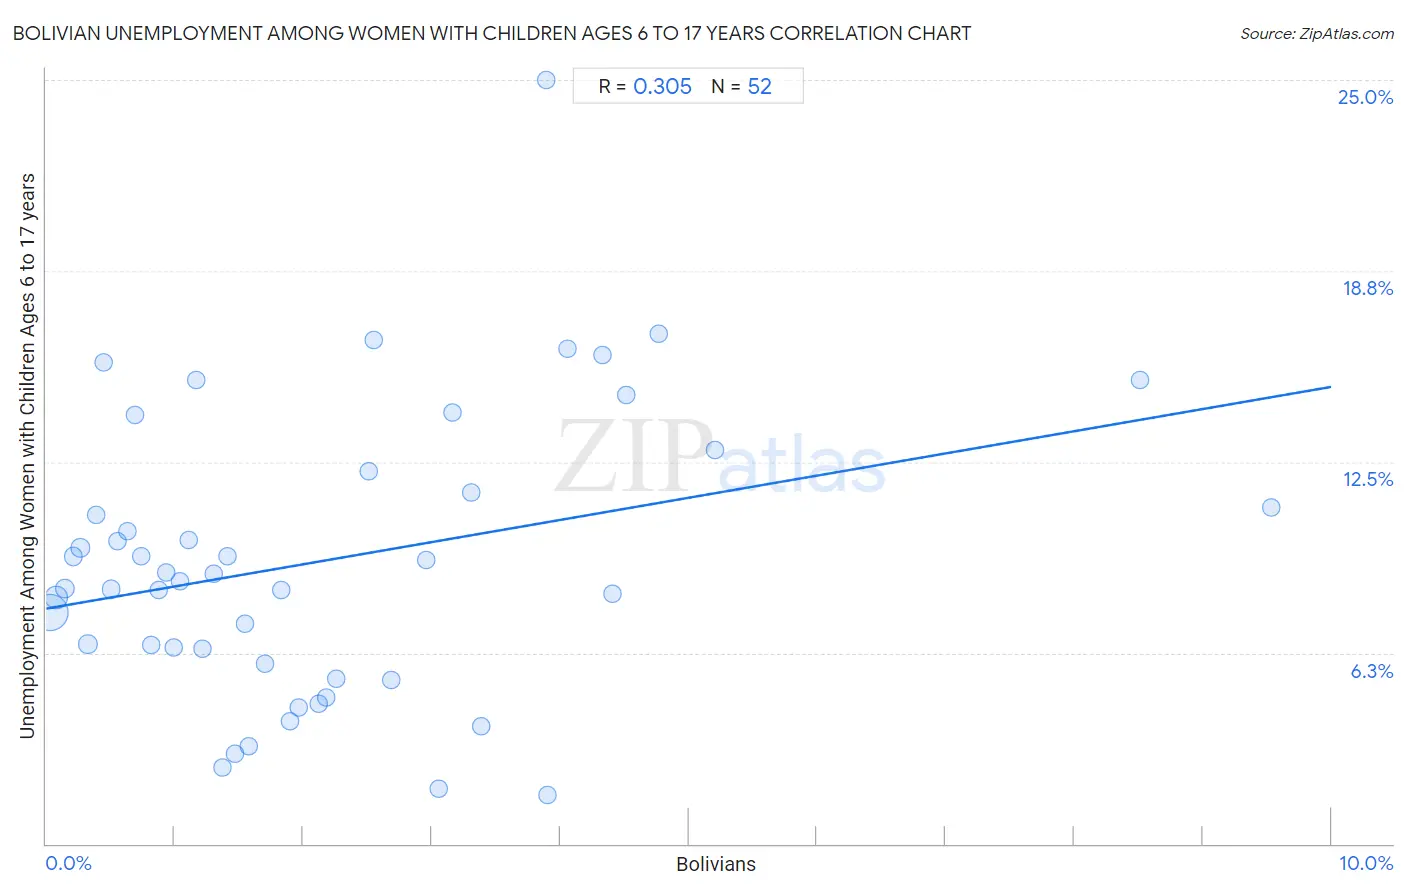
Bolivian Unemployment Among Women with Children Ages 6 to 17 years Correlation Chart
The statistical analysis conducted on geographies consisting of 151,015,962 people shows a mild positive correlation between the proportion of Bolivians and unemployment rate among women with children between the ages 6 and 17 in the United States with a correlation coefficient (R) of 0.305 and weighted average of 8.5%. On average, for every 1% (one percent) increase in Bolivians within a typical geography, there is an increase of 0.73% in unemployment rate among women with children between the ages 6 and 17.
It is essential to understand that the correlation between the percentage of Bolivians and unemployment rate among women with children between the ages 6 and 17 does not imply a direct cause-and-effect relationship. It remains uncertain whether the presence of Bolivians influences an upward or downward trend in the level of unemployment rate among women with children between the ages 6 and 17 within an area, or if Bolivians simply ended up residing in those areas with higher or lower levels of unemployment rate among women with children between the ages 6 and 17 due to other factors.
Demographics Similar to Bolivians by Unemployment Among Women with Children Ages 6 to 17 years
In terms of unemployment among women with children ages 6 to 17 years, the demographic groups most similar to Bolivians are Malaysian (8.6%, a difference of 0.040%), German Russian (8.5%, a difference of 0.090%), Immigrants from Lithuania (8.6%, a difference of 0.12%), New Zealander (8.6%, a difference of 0.12%), and Immigrants from Pakistan (8.6%, a difference of 0.12%).
| Demographics | Rating | Rank | Unemployment Among Women with Children Ages 6 to 17 years |
| Yugoslavians | 99.0 /100 | #90 | Exceptional 8.5% |
| Immigrants from Eastern Europe | 99.0 /100 | #91 | Exceptional 8.5% |
| Potawatomi | 99.0 /100 | #92 | Exceptional 8.5% |
| Australians | 98.9 /100 | #93 | Exceptional 8.5% |
| Immigrants from Barbados | 98.8 /100 | #94 | Exceptional 8.5% |
| Sri Lankans | 98.7 /100 | #95 | Exceptional 8.5% |
| German Russians | 98.6 /100 | #96 | Exceptional 8.5% |
| Bolivians | 98.5 /100 | #97 | Exceptional 8.5% |
| Malaysians | 98.5 /100 | #98 | Exceptional 8.6% |
| Immigrants from Lithuania | 98.4 /100 | #99 | Exceptional 8.6% |
| New Zealanders | 98.4 /100 | #100 | Exceptional 8.6% |
| Immigrants from Pakistan | 98.4 /100 | #101 | Exceptional 8.6% |
| Immigrants from South Africa | 98.3 /100 | #102 | Exceptional 8.6% |
| Scandinavians | 98.3 /100 | #103 | Exceptional 8.6% |
| Immigrants from France | 98.0 /100 | #104 | Exceptional 8.6% |
Bolivian Unemployment Among Women with Children Ages 6 to 17 years Correlation Summary
| Measurement | Bolivian Data | Unemployment Among Women with Children Ages 6 to 17 years Data |
| Minimum | 0.028% | 1.6% |
| Maximum | 9.5% | 25.0% |
| Range | 9.5% | 23.4% |
| Mean | 2.2% | 9.3% |
| Median | 1.6% | 8.7% |
| Interquartile 25% (IQ1) | 0.78% | 6.2% |
| Interquartile 75% (IQ3) | 3.1% | 11.8% |
| Interquartile Range (IQR) | 2.3% | 5.7% |
| Standard Deviation (Sample) | 2.0% | 4.7% |
| Standard Deviation (Population) | 1.9% | 4.6% |
Correlation Details
| Bolivian Percentile | Sample Size | Unemployment Among Women with Children Ages 6 to 17 years |
[ 0.0% - 0.5% ] 0.028% | 98,761,510 | 7.6% |
[ 0.0% - 0.5% ] 0.082% | 26,412,143 | 8.0% |
[ 0.0% - 0.5% ] 0.15% | 8,102,357 | 8.3% |
[ 0.0% - 0.5% ] 0.21% | 4,150,571 | 9.4% |
[ 0.0% - 0.5% ] 0.26% | 3,060,651 | 9.7% |
[ 0.0% - 0.5% ] 0.33% | 2,359,442 | 6.5% |
[ 0.0% - 0.5% ] 0.38% | 1,118,844 | 10.7% |
[ 0.0% - 0.5% ] 0.45% | 1,068,594 | 15.7% |
[ 0.5% - 1.0% ] 0.50% | 1,064,473 | 8.3% |
[ 0.5% - 1.0% ] 0.56% | 567,225 | 9.9% |
[ 0.5% - 1.0% ] 0.64% | 469,206 | 10.2% |
[ 0.5% - 1.0% ] 0.69% | 323,603 | 14.0% |
[ 0.5% - 1.0% ] 0.74% | 228,362 | 9.4% |
[ 0.5% - 1.0% ] 0.81% | 495,387 | 6.5% |
[ 0.5% - 1.0% ] 0.88% | 197,310 | 8.3% |
[ 0.5% - 1.0% ] 0.93% | 238,381 | 8.9% |
[ 0.5% - 1.0% ] 0.99% | 177,279 | 6.4% |
[ 1.0% - 1.5% ] 1.05% | 148,054 | 8.6% |
[ 1.0% - 1.5% ] 1.11% | 164,931 | 9.9% |
[ 1.0% - 1.5% ] 1.16% | 202,140 | 15.2% |
[ 1.0% - 1.5% ] 1.21% | 33,358 | 6.4% |
[ 1.0% - 1.5% ] 1.30% | 60,544 | 8.8% |
[ 1.0% - 1.5% ] 1.37% | 44,781 | 2.5% |
[ 1.0% - 1.5% ] 1.41% | 63,718 | 9.4% |
[ 1.0% - 1.5% ] 1.47% | 245,862 | 2.9% |
[ 1.5% - 2.0% ] 1.54% | 119,565 | 7.2% |
[ 1.5% - 2.0% ] 1.58% | 35,710 | 3.2% |
[ 1.5% - 2.0% ] 1.70% | 63,493 | 5.9% |
[ 1.5% - 2.0% ] 1.83% | 104,861 | 8.3% |
[ 1.5% - 2.0% ] 1.90% | 87,466 | 4.0% |
[ 1.5% - 2.0% ] 1.96% | 109,564 | 4.4% |
[ 2.0% - 2.5% ] 2.13% | 17,926 | 4.6% |
[ 2.0% - 2.5% ] 2.18% | 42,249 | 4.8% |
[ 2.0% - 2.5% ] 2.26% | 73,928 | 5.4% |
[ 2.5% - 3.0% ] 2.51% | 14,042 | 12.2% |
[ 2.5% - 3.0% ] 2.55% | 7,531 | 16.5% |
[ 2.5% - 3.0% ] 2.68% | 92,937 | 5.3% |
[ 2.5% - 3.0% ] 2.96% | 44,228 | 9.3% |
[ 3.0% - 3.5% ] 3.05% | 24,785 | 1.8% |
[ 3.0% - 3.5% ] 3.16% | 6,238 | 14.1% |
[ 3.0% - 3.5% ] 3.31% | 44,959 | 11.5% |
[ 3.0% - 3.5% ] 3.38% | 104,831 | 3.8% |
[ 3.5% - 4.0% ] 3.89% | 6,916 | 25.0% |
[ 3.5% - 4.0% ] 3.90% | 52,359 | 1.6% |
[ 4.0% - 4.5% ] 4.06% | 31,058 | 16.2% |
[ 4.0% - 4.5% ] 4.33% | 42,310 | 16.0% |
[ 4.0% - 4.5% ] 4.41% | 42,330 | 8.2% |
[ 4.5% - 5.0% ] 4.52% | 12,818 | 14.7% |
[ 4.5% - 5.0% ] 4.77% | 2,641 | 16.7% |
[ 5.0% - 5.5% ] 5.21% | 6,510 | 12.9% |
[ 8.5% - 9.0% ] 8.51% | 34,860 | 15.2% |
[ 9.5% - 10.0% ] 9.54% | 31,121 | 11.0% |