Bolivian vs Trinidadian and Tobagonian Married-Couple Family Poverty
COMPARE
Bolivian
Trinidadian and Tobagonian
Married-Couple Family Poverty
Married-Couple Family Poverty Comparison
Bolivians
Trinidadians and Tobagonians
4.6%
MARRIED-COUPLE FAMILY POVERTY
98.6/ 100
METRIC RATING
88th/ 347
METRIC RANK
6.2%
MARRIED-COUPLE FAMILY POVERTY
0.1/ 100
METRIC RATING
272nd/ 347
METRIC RANK
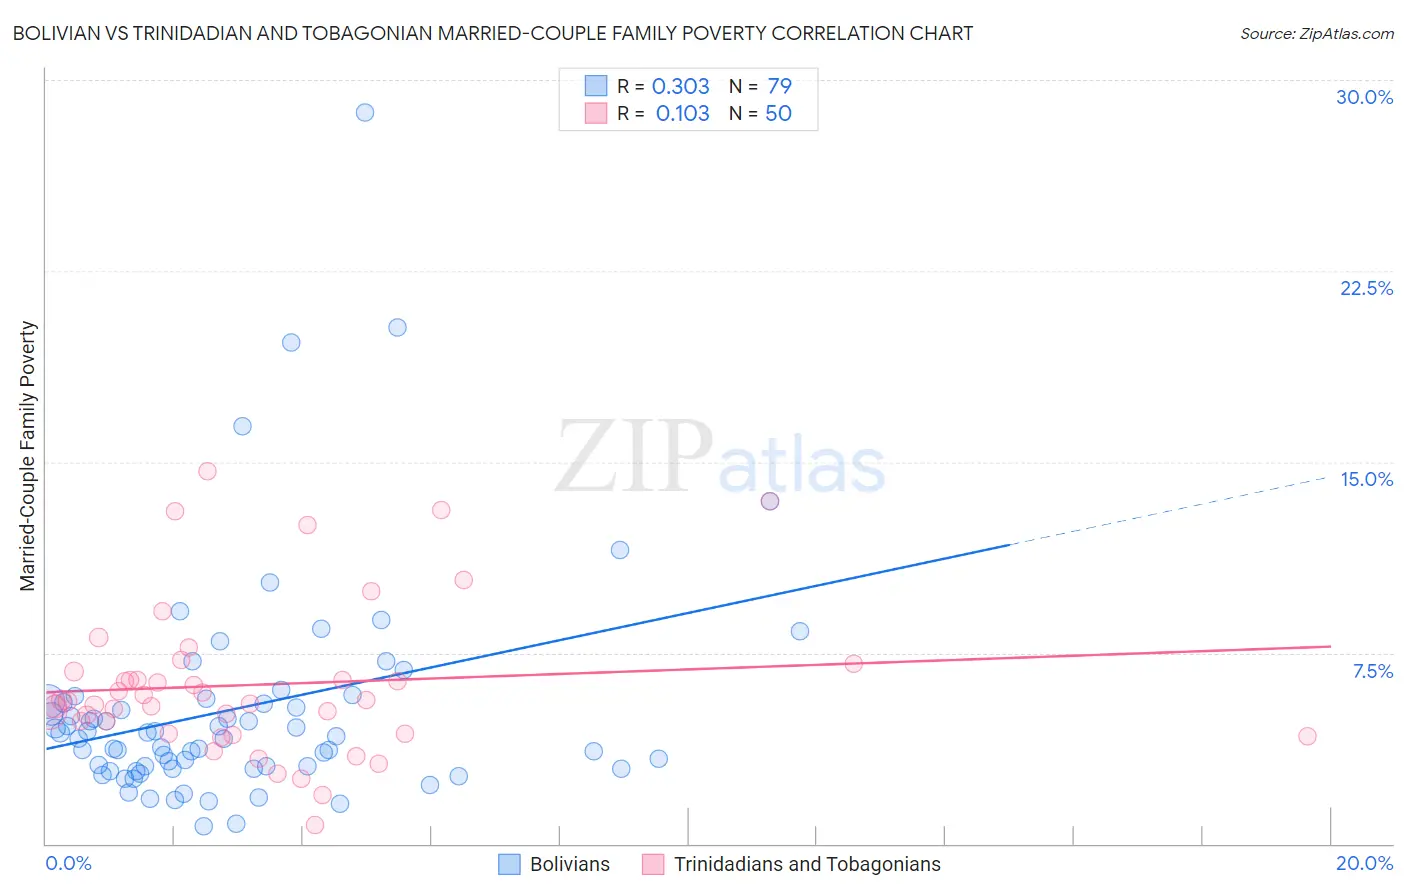
Bolivian vs Trinidadian and Tobagonian Married-Couple Family Poverty Correlation Chart
The statistical analysis conducted on geographies consisting of 183,808,216 people shows a mild positive correlation between the proportion of Bolivians and poverty level among married-couple families in the United States with a correlation coefficient (R) of 0.303 and weighted average of 4.6%. Similarly, the statistical analysis conducted on geographies consisting of 218,634,387 people shows a poor positive correlation between the proportion of Trinidadians and Tobagonians and poverty level among married-couple families in the United States with a correlation coefficient (R) of 0.103 and weighted average of 6.2%, a difference of 36.1%.
Married-Couple Family Poverty Correlation Summary
| Measurement | Bolivian | Trinidadian and Tobagonian |
| Minimum | 0.69% | 0.75% |
| Maximum | 28.7% | 14.6% |
| Range | 28.0% | 13.9% |
| Mean | 5.3% | 6.3% |
| Median | 4.2% | 5.6% |
| Interquartile 25% (IQ1) | 3.0% | 4.3% |
| Interquartile 75% (IQ3) | 5.6% | 6.8% |
| Interquartile Range (IQR) | 2.6% | 2.4% |
| Standard Deviation (Sample) | 4.5% | 3.0% |
| Standard Deviation (Population) | 4.5% | 3.0% |
Similar Demographics by Married-Couple Family Poverty
Demographics Similar to Bolivians by Married-Couple Family Poverty
In terms of married-couple family poverty, the demographic groups most similar to Bolivians are Immigrants from North Macedonia (4.6%, a difference of 0.10%), Immigrants from Czechoslovakia (4.6%, a difference of 0.11%), Immigrants from Turkey (4.6%, a difference of 0.18%), Immigrants from Switzerland (4.6%, a difference of 0.18%), and South African (4.6%, a difference of 0.22%).
| Demographics | Rating | Rank | Married-Couple Family Poverty |
| Immigrants | Greece | 98.9 /100 | #81 | Exceptional 4.5% |
| Canadians | 98.8 /100 | #82 | Exceptional 4.5% |
| Immigrants | Denmark | 98.8 /100 | #83 | Exceptional 4.6% |
| Immigrants | Croatia | 98.7 /100 | #84 | Exceptional 4.6% |
| South Africans | 98.7 /100 | #85 | Exceptional 4.6% |
| Immigrants | Turkey | 98.6 /100 | #86 | Exceptional 4.6% |
| Immigrants | North Macedonia | 98.6 /100 | #87 | Exceptional 4.6% |
| Bolivians | 98.6 /100 | #88 | Exceptional 4.6% |
| Immigrants | Czechoslovakia | 98.5 /100 | #89 | Exceptional 4.6% |
| Immigrants | Switzerland | 98.5 /100 | #90 | Exceptional 4.6% |
| Basques | 98.5 /100 | #91 | Exceptional 4.6% |
| Immigrants | Norway | 98.4 /100 | #92 | Exceptional 4.6% |
| Koreans | 98.3 /100 | #93 | Exceptional 4.6% |
| Immigrants | Italy | 98.3 /100 | #94 | Exceptional 4.6% |
| Portuguese | 98.3 /100 | #95 | Exceptional 4.6% |
Demographics Similar to Trinidadians and Tobagonians by Married-Couple Family Poverty
In terms of married-couple family poverty, the demographic groups most similar to Trinidadians and Tobagonians are Immigrants from Bahamas (6.2%, a difference of 0.030%), Immigrants from Jamaica (6.2%, a difference of 0.25%), Immigrants from West Indies (6.2%, a difference of 0.29%), Alaska Native (6.2%, a difference of 0.46%), and Colville (6.3%, a difference of 0.78%).
| Demographics | Rating | Rank | Married-Couple Family Poverty |
| Blackfeet | 0.2 /100 | #265 | Tragic 6.2% |
| Creek | 0.2 /100 | #266 | Tragic 6.2% |
| Spanish Americans | 0.2 /100 | #267 | Tragic 6.2% |
| Alaska Natives | 0.2 /100 | #268 | Tragic 6.2% |
| Immigrants | West Indies | 0.1 /100 | #269 | Tragic 6.2% |
| Immigrants | Jamaica | 0.1 /100 | #270 | Tragic 6.2% |
| Immigrants | Bahamas | 0.1 /100 | #271 | Tragic 6.2% |
| Trinidadians and Tobagonians | 0.1 /100 | #272 | Tragic 6.2% |
| Colville | 0.1 /100 | #273 | Tragic 6.3% |
| Barbadians | 0.1 /100 | #274 | Tragic 6.3% |
| Choctaw | 0.1 /100 | #275 | Tragic 6.3% |
| Yaqui | 0.1 /100 | #276 | Tragic 6.3% |
| Indonesians | 0.1 /100 | #277 | Tragic 6.3% |
| Immigrants | Trinidad and Tobago | 0.1 /100 | #278 | Tragic 6.4% |
| Houma | 0.0 /100 | #279 | Tragic 6.4% |