Bolivian 4 or more Vehicles in Household
COMPARE
Bolivian
Select to Compare
4 or more Vehicles in Household
Bolivian 4 or more Vehicles in Household
6.8%
4+ VEHICLES AVAILABLE
96.3/ 100
METRIC RATING
114th/ 347
METRIC RANK
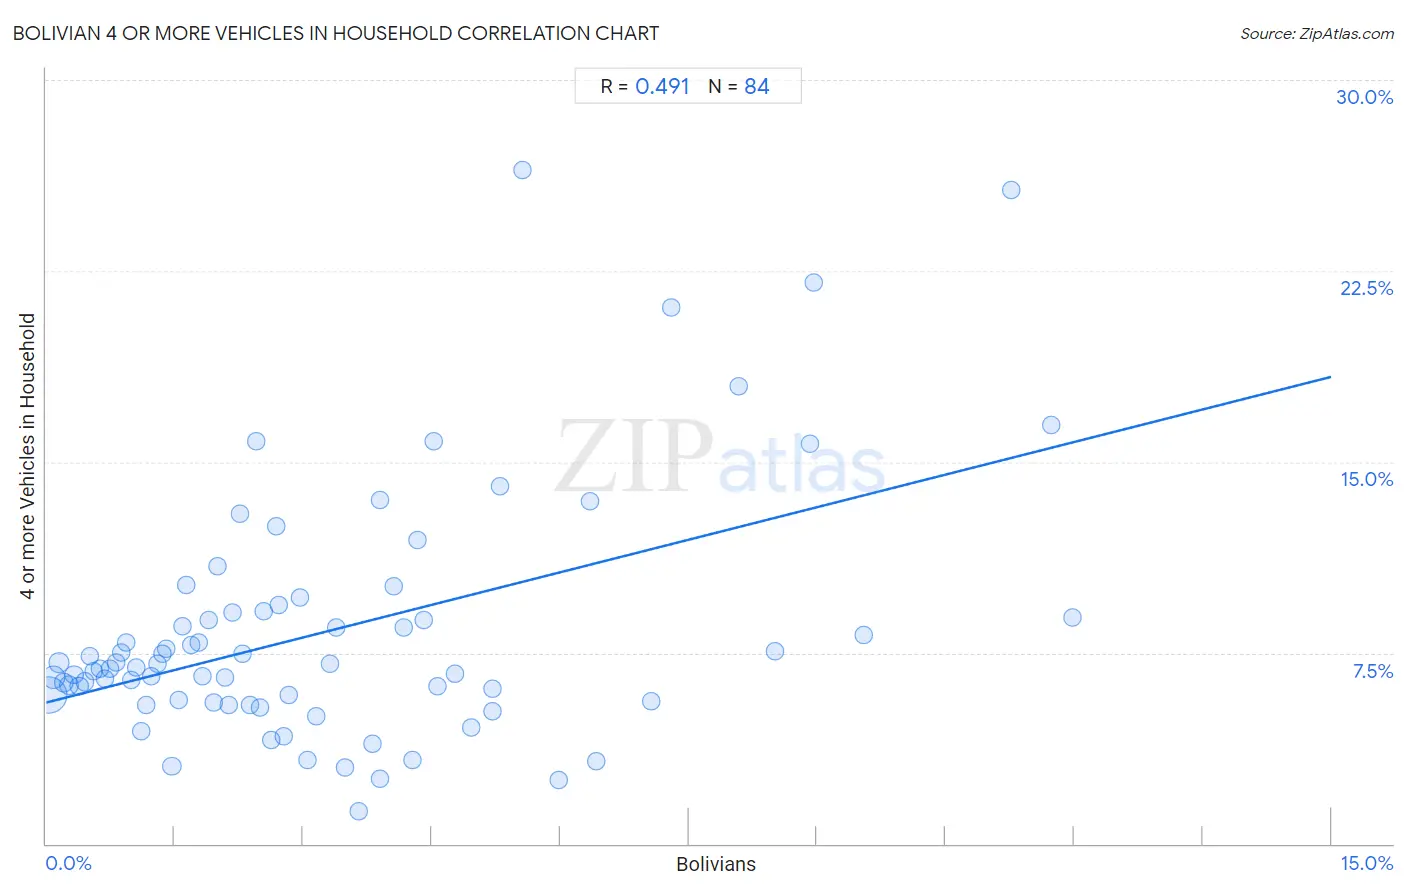
Bolivian 4 or more Vehicles in Household Correlation Chart
The statistical analysis conducted on geographies consisting of 183,943,561 people shows a moderate positive correlation between the proportion of Bolivians and percentage of households with 4 or more vehicles available in the United States with a correlation coefficient (R) of 0.491 and weighted average of 6.8%. On average, for every 1% (one percent) increase in Bolivians within a typical geography, there is an increase of 0.85% in percentage of households with 4 or more vehicles available.
It is essential to understand that the correlation between the percentage of Bolivians and percentage of households with 4 or more vehicles available does not imply a direct cause-and-effect relationship. It remains uncertain whether the presence of Bolivians influences an upward or downward trend in the level of percentage of households with 4 or more vehicles available within an area, or if Bolivians simply ended up residing in those areas with higher or lower levels of percentage of households with 4 or more vehicles available due to other factors.
Demographics Similar to Bolivians by 4 or more Vehicles in Household
In terms of 4 or more vehicles in household, the demographic groups most similar to Bolivians are Canadian (6.9%, a difference of 0.050%), Tlingit-Haida (6.8%, a difference of 0.060%), Immigrants from Guatemala (6.8%, a difference of 0.32%), Burmese (6.8%, a difference of 0.34%), and French American Indian (6.8%, a difference of 0.34%).
| Demographics | Rating | Rank | 4 or more Vehicles in Household |
| Nicaraguans | 98.0 /100 | #107 | Exceptional 7.0% |
| French | 97.7 /100 | #108 | Exceptional 6.9% |
| Filipinos | 97.6 /100 | #109 | Exceptional 6.9% |
| Immigrants from Thailand | 97.0 /100 | #110 | Exceptional 6.9% |
| Aleuts | 97.0 /100 | #111 | Exceptional 6.9% |
| Hopi | 97.0 /100 | #112 | Exceptional 6.9% |
| Canadians | 96.4 /100 | #113 | Exceptional 6.9% |
| Bolivians | 96.3 /100 | #114 | Exceptional 6.8% |
| Tlingit-Haida | 96.2 /100 | #115 | Exceptional 6.8% |
| Immigrants from Guatemala | 95.8 /100 | #116 | Exceptional 6.8% |
| Burmese | 95.7 /100 | #117 | Exceptional 6.8% |
| French American Indians | 95.7 /100 | #118 | Exceptional 6.8% |
| Costa Ricans | 95.5 /100 | #119 | Exceptional 6.8% |
| Comanche | 94.8 /100 | #120 | Exceptional 6.8% |
| Immigrants from Germany | 94.7 /100 | #121 | Exceptional 6.8% |
Bolivian 4 or more Vehicles in Household Correlation Summary
| Measurement | Bolivian Data | 4 or more Vehicles in Household Data |
| Minimum | 0.028% | 1.3% |
| Maximum | 12.0% | 26.5% |
| Range | 12.0% | 25.2% |
| Mean | 3.3% | 8.4% |
| Median | 2.5% | 7.0% |
| Interquartile 25% (IQ1) | 1.3% | 5.6% |
| Interquartile 75% (IQ3) | 4.5% | 9.1% |
| Interquartile Range (IQR) | 3.2% | 3.5% |
| Standard Deviation (Sample) | 2.8% | 4.9% |
| Standard Deviation (Population) | 2.8% | 4.8% |
Correlation Details
| Bolivian Percentile | Sample Size | 4 or more Vehicles in Household |
[ 0.0% - 0.5% ] 0.028% | 111,766,025 | 5.9% |
[ 0.0% - 0.5% ] 0.083% | 32,730,982 | 6.5% |
[ 0.0% - 0.5% ] 0.15% | 12,373,111 | 7.1% |
[ 0.0% - 0.5% ] 0.21% | 6,335,661 | 6.3% |
[ 0.0% - 0.5% ] 0.26% | 4,756,499 | 6.2% |
[ 0.0% - 0.5% ] 0.33% | 3,332,941 | 6.6% |
[ 0.0% - 0.5% ] 0.38% | 2,015,759 | 6.2% |
[ 0.0% - 0.5% ] 0.45% | 1,433,713 | 6.4% |
[ 0.5% - 1.0% ] 0.50% | 1,520,668 | 7.4% |
[ 0.5% - 1.0% ] 0.56% | 883,410 | 6.8% |
[ 0.5% - 1.0% ] 0.63% | 680,616 | 6.9% |
[ 0.5% - 1.0% ] 0.69% | 613,855 | 6.5% |
[ 0.5% - 1.0% ] 0.74% | 404,195 | 6.9% |
[ 0.5% - 1.0% ] 0.81% | 682,957 | 7.1% |
[ 0.5% - 1.0% ] 0.88% | 320,962 | 7.5% |
[ 0.5% - 1.0% ] 0.93% | 364,945 | 7.9% |
[ 0.5% - 1.0% ] 0.99% | 266,828 | 6.4% |
[ 1.0% - 1.5% ] 1.05% | 221,324 | 6.9% |
[ 1.0% - 1.5% ] 1.11% | 240,043 | 4.4% |
[ 1.0% - 1.5% ] 1.16% | 282,738 | 5.5% |
[ 1.0% - 1.5% ] 1.22% | 45,681 | 6.6% |
[ 1.0% - 1.5% ] 1.29% | 87,035 | 7.1% |
[ 1.0% - 1.5% ] 1.36% | 63,066 | 7.5% |
[ 1.0% - 1.5% ] 1.41% | 164,398 | 7.7% |
[ 1.0% - 1.5% ] 1.47% | 342,328 | 3.0% |
[ 1.5% - 2.0% ] 1.54% | 175,867 | 5.6% |
[ 1.5% - 2.0% ] 1.59% | 76,129 | 8.6% |
[ 1.5% - 2.0% ] 1.63% | 59,518 | 10.2% |
[ 1.5% - 2.0% ] 1.69% | 121,022 | 7.8% |
[ 1.5% - 2.0% ] 1.79% | 89,922 | 7.9% |
[ 1.5% - 2.0% ] 1.83% | 188,301 | 6.6% |
[ 1.5% - 2.0% ] 1.90% | 110,573 | 8.8% |
[ 1.5% - 2.0% ] 1.96% | 110,132 | 5.5% |
[ 2.0% - 2.5% ] 2.00% | 29,528 | 10.9% |
[ 2.0% - 2.5% ] 2.08% | 14,729 | 6.5% |
[ 2.0% - 2.5% ] 2.13% | 32,264 | 5.4% |
[ 2.0% - 2.5% ] 2.17% | 91,354 | 9.1% |
[ 2.0% - 2.5% ] 2.26% | 81,812 | 13.0% |
[ 2.0% - 2.5% ] 2.29% | 22,263 | 7.5% |
[ 2.0% - 2.5% ] 2.37% | 24,184 | 5.4% |
[ 2.0% - 2.5% ] 2.45% | 3,312 | 15.8% |
[ 2.0% - 2.5% ] 2.49% | 20,887 | 5.3% |
[ 2.5% - 3.0% ] 2.54% | 25,877 | 9.2% |
[ 2.5% - 3.0% ] 2.63% | 2,969 | 4.1% |
[ 2.5% - 3.0% ] 2.68% | 99,621 | 12.5% |
[ 2.5% - 3.0% ] 2.71% | 12,337 | 9.4% |
[ 2.5% - 3.0% ] 2.77% | 17,788 | 4.2% |
[ 2.5% - 3.0% ] 2.82% | 28,750 | 5.9% |
[ 2.5% - 3.0% ] 2.96% | 44,228 | 9.7% |
[ 3.0% - 3.5% ] 3.05% | 24,785 | 3.3% |
[ 3.0% - 3.5% ] 3.16% | 6,966 | 5.0% |
[ 3.0% - 3.5% ] 3.31% | 46,749 | 7.1% |
[ 3.0% - 3.5% ] 3.38% | 139,797 | 8.5% |
[ 3.0% - 3.5% ] 3.49% | 1,463 | 3.0% |
[ 3.5% - 4.0% ] 3.65% | 8,024 | 1.3% |
[ 3.5% - 4.0% ] 3.81% | 1,757 | 3.9% |
[ 3.5% - 4.0% ] 3.89% | 6,916 | 13.5% |
[ 3.5% - 4.0% ] 3.90% | 52,359 | 2.5% |
[ 4.0% - 4.5% ] 4.06% | 33,110 | 10.1% |
[ 4.0% - 4.5% ] 4.17% | 336 | 8.5% |
[ 4.0% - 4.5% ] 4.27% | 679 | 3.3% |
[ 4.0% - 4.5% ] 4.33% | 46,313 | 11.9% |
[ 4.0% - 4.5% ] 4.41% | 42,330 | 8.8% |
[ 4.5% - 5.0% ] 4.52% | 12,818 | 15.8% |
[ 4.5% - 5.0% ] 4.57% | 2,211 | 6.2% |
[ 4.5% - 5.0% ] 4.77% | 3,104 | 6.7% |
[ 4.5% - 5.0% ] 4.96% | 746 | 4.5% |
[ 5.0% - 5.5% ] 5.21% | 6,510 | 5.2% |
[ 5.0% - 5.5% ] 5.22% | 6,500 | 6.1% |
[ 5.0% - 5.5% ] 5.30% | 736 | 14.0% |
[ 5.5% - 6.0% ] 5.56% | 1,277 | 26.5% |
[ 5.5% - 6.0% ] 5.98% | 1,271 | 2.5% |
[ 6.0% - 6.5% ] 6.34% | 347 | 13.5% |
[ 6.0% - 6.5% ] 6.42% | 1,837 | 3.3% |
[ 7.0% - 7.5% ] 7.06% | 1,883 | 5.6% |
[ 7.0% - 7.5% ] 7.30% | 1,137 | 21.0% |
[ 8.0% - 8.5% ] 8.09% | 272 | 17.9% |
[ 8.5% - 9.0% ] 8.51% | 34,860 | 7.6% |
[ 8.5% - 9.0% ] 8.92% | 2,533 | 15.7% |
[ 8.5% - 9.0% ] 8.96% | 3,851 | 22.0% |
[ 9.5% - 10.0% ] 9.54% | 31,121 | 8.2% |
[ 11.0% - 11.5% ] 11.27% | 630 | 25.7% |
[ 11.5% - 12.0% ] 11.73% | 1,202 | 16.5% |
[ 11.5% - 12.0% ] 11.98% | 4,024 | 8.9% |