Bolivian College, Under 1 year
COMPARE
Bolivian
Select to Compare
College, Under 1 year
Bolivian College, Under 1 year
68.7%
COLLEGE, UNDER 1 YEAR
99.0/ 100
METRIC RATING
72nd/ 347
METRIC RANK
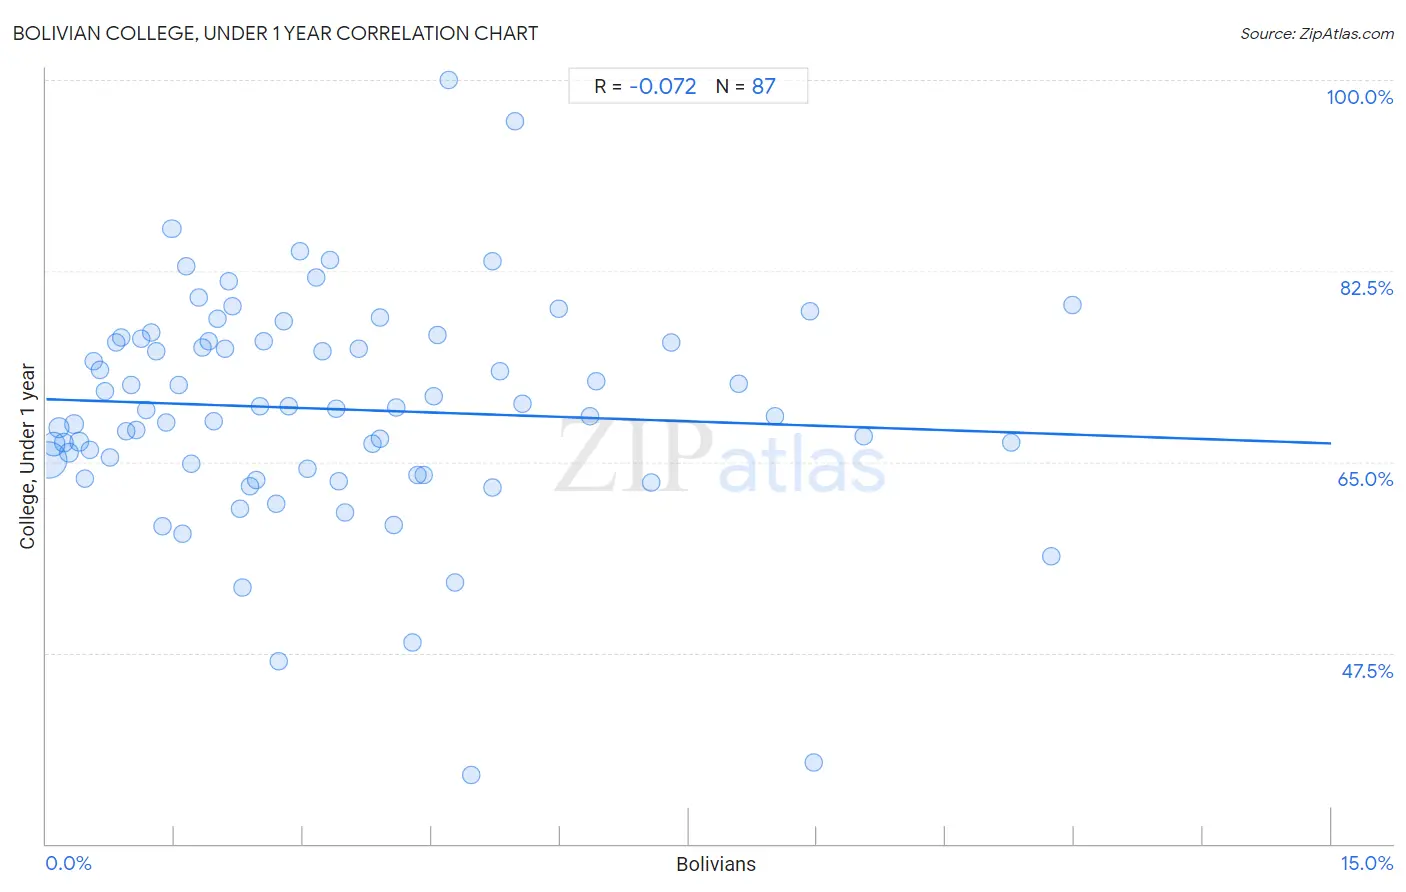
Bolivian College, Under 1 year Correlation Chart
The statistical analysis conducted on geographies consisting of 184,667,998 people shows a slight negative correlation between the proportion of Bolivians and percentage of population with at least college, under 1 year education in the United States with a correlation coefficient (R) of -0.072 and weighted average of 68.7%. On average, for every 1% (one percent) increase in Bolivians within a typical geography, there is a decrease of 0.27% in percentage of population with at least college, under 1 year education.
It is essential to understand that the correlation between the percentage of Bolivians and percentage of population with at least college, under 1 year education does not imply a direct cause-and-effect relationship. It remains uncertain whether the presence of Bolivians influences an upward or downward trend in the level of percentage of population with at least college, under 1 year education within an area, or if Bolivians simply ended up residing in those areas with higher or lower levels of percentage of population with at least college, under 1 year education due to other factors.
Demographics Similar to Bolivians by College, Under 1 year
In terms of college, under 1 year, the demographic groups most similar to Bolivians are Immigrants from Europe (68.8%, a difference of 0.040%), Immigrants from England (68.7%, a difference of 0.040%), Lithuanian (68.8%, a difference of 0.060%), Swedish (68.7%, a difference of 0.090%), and Immigrants from Romania (68.9%, a difference of 0.22%).
| Demographics | Rating | Rank | College, Under 1 year |
| Immigrants from Moldova | 99.3 /100 | #65 | Exceptional 69.0% |
| Immigrants from North America | 99.3 /100 | #66 | Exceptional 69.0% |
| Immigrants from Zimbabwe | 99.2 /100 | #67 | Exceptional 68.9% |
| Immigrants from Indonesia | 99.2 /100 | #68 | Exceptional 68.9% |
| Immigrants from Romania | 99.2 /100 | #69 | Exceptional 68.9% |
| Lithuanians | 99.1 /100 | #70 | Exceptional 68.8% |
| Immigrants from Europe | 99.1 /100 | #71 | Exceptional 68.8% |
| Bolivians | 99.0 /100 | #72 | Exceptional 68.7% |
| Immigrants from England | 99.0 /100 | #73 | Exceptional 68.7% |
| Swedes | 98.9 /100 | #74 | Exceptional 68.7% |
| Immigrants from Western Europe | 98.6 /100 | #75 | Exceptional 68.5% |
| Laotians | 98.6 /100 | #76 | Exceptional 68.5% |
| British | 98.6 /100 | #77 | Exceptional 68.5% |
| Danes | 98.6 /100 | #78 | Exceptional 68.5% |
| Greeks | 98.6 /100 | #79 | Exceptional 68.5% |
Bolivian College, Under 1 year Correlation Summary
| Measurement | Bolivian Data | College, Under 1 year Data |
| Minimum | 0.028% | 36.3% |
| Maximum | 12.0% | 100.0% |
| Range | 12.0% | 63.7% |
| Mean | 3.3% | 69.8% |
| Median | 2.7% | 69.8% |
| Interquartile 25% (IQ1) | 1.3% | 64.4% |
| Interquartile 75% (IQ3) | 4.6% | 76.1% |
| Interquartile Range (IQR) | 3.3% | 11.7% |
| Standard Deviation (Sample) | 2.8% | 10.3% |
| Standard Deviation (Population) | 2.7% | 10.3% |
Correlation Details
| Bolivian Percentile | Sample Size | College, Under 1 year |
[ 0.0% - 0.5% ] 0.028% | 111,871,705 | 65.2% |
[ 0.0% - 0.5% ] 0.083% | 32,954,408 | 66.6% |
[ 0.0% - 0.5% ] 0.15% | 12,512,116 | 68.1% |
[ 0.0% - 0.5% ] 0.21% | 6,358,582 | 66.8% |
[ 0.0% - 0.5% ] 0.26% | 4,783,548 | 65.9% |
[ 0.0% - 0.5% ] 0.33% | 3,361,091 | 68.5% |
[ 0.0% - 0.5% ] 0.38% | 2,053,370 | 66.8% |
[ 0.0% - 0.5% ] 0.45% | 1,507,988 | 63.5% |
[ 0.5% - 1.0% ] 0.50% | 1,528,417 | 66.1% |
[ 0.5% - 1.0% ] 0.56% | 910,349 | 74.2% |
[ 0.5% - 1.0% ] 0.63% | 689,798 | 73.4% |
[ 0.5% - 1.0% ] 0.69% | 613,855 | 71.5% |
[ 0.5% - 1.0% ] 0.74% | 404,466 | 65.4% |
[ 0.5% - 1.0% ] 0.81% | 682,957 | 75.9% |
[ 0.5% - 1.0% ] 0.87% | 322,978 | 76.4% |
[ 0.5% - 1.0% ] 0.93% | 367,146 | 67.8% |
[ 0.5% - 1.0% ] 0.99% | 266,828 | 72.0% |
[ 1.0% - 1.5% ] 1.05% | 222,186 | 67.9% |
[ 1.0% - 1.5% ] 1.11% | 240,043 | 76.3% |
[ 1.0% - 1.5% ] 1.16% | 282,908 | 69.7% |
[ 1.0% - 1.5% ] 1.22% | 45,681 | 76.8% |
[ 1.0% - 1.5% ] 1.29% | 89,237 | 75.2% |
[ 1.0% - 1.5% ] 1.36% | 63,066 | 59.1% |
[ 1.0% - 1.5% ] 1.41% | 164,398 | 68.6% |
[ 1.0% - 1.5% ] 1.47% | 342,328 | 86.3% |
[ 1.5% - 2.0% ] 1.54% | 175,867 | 72.0% |
[ 1.5% - 2.0% ] 1.59% | 80,352 | 58.4% |
[ 1.5% - 2.0% ] 1.63% | 59,518 | 82.9% |
[ 1.5% - 2.0% ] 1.69% | 121,022 | 64.9% |
[ 1.5% - 2.0% ] 1.79% | 89,922 | 80.0% |
[ 1.5% - 2.0% ] 1.83% | 188,301 | 75.5% |
[ 1.5% - 2.0% ] 1.90% | 110,573 | 76.1% |
[ 1.5% - 2.0% ] 1.96% | 110,132 | 68.7% |
[ 2.0% - 2.5% ] 2.00% | 29,528 | 78.2% |
[ 2.0% - 2.5% ] 2.08% | 14,729 | 75.4% |
[ 2.0% - 2.5% ] 2.13% | 32,264 | 81.6% |
[ 2.0% - 2.5% ] 2.17% | 91,354 | 79.2% |
[ 2.0% - 2.5% ] 2.26% | 81,812 | 60.7% |
[ 2.0% - 2.5% ] 2.29% | 22,263 | 53.5% |
[ 2.0% - 2.5% ] 2.37% | 24,184 | 62.7% |
[ 2.0% - 2.5% ] 2.45% | 3,312 | 63.3% |
[ 2.0% - 2.5% ] 2.49% | 20,887 | 70.1% |
[ 2.5% - 3.0% ] 2.54% | 25,877 | 76.1% |
[ 2.5% - 3.0% ] 2.68% | 99,621 | 61.2% |
[ 2.5% - 3.0% ] 2.71% | 12,337 | 46.7% |
[ 2.5% - 3.0% ] 2.77% | 17,788 | 77.9% |
[ 2.5% - 3.0% ] 2.82% | 28,750 | 70.1% |
[ 2.5% - 3.0% ] 2.96% | 44,228 | 84.3% |
[ 3.0% - 3.5% ] 3.05% | 24,785 | 64.4% |
[ 3.0% - 3.5% ] 3.16% | 6,966 | 81.9% |
[ 3.0% - 3.5% ] 3.23% | 8,975 | 75.2% |
[ 3.0% - 3.5% ] 3.31% | 46,749 | 83.5% |
[ 3.0% - 3.5% ] 3.38% | 139,797 | 69.8% |
[ 3.0% - 3.5% ] 3.42% | 643 | 63.2% |
[ 3.0% - 3.5% ] 3.49% | 1,463 | 60.4% |
[ 3.5% - 4.0% ] 3.65% | 8,024 | 75.4% |
[ 3.5% - 4.0% ] 3.80% | 3,681 | 66.6% |
[ 3.5% - 4.0% ] 3.89% | 6,916 | 67.2% |
[ 3.5% - 4.0% ] 3.90% | 52,359 | 78.2% |
[ 4.0% - 4.5% ] 4.06% | 33,110 | 59.2% |
[ 4.0% - 4.5% ] 4.09% | 709 | 70.0% |
[ 4.0% - 4.5% ] 4.27% | 679 | 48.4% |
[ 4.0% - 4.5% ] 4.33% | 46,313 | 63.8% |
[ 4.0% - 4.5% ] 4.41% | 42,330 | 63.8% |
[ 4.5% - 5.0% ] 4.52% | 12,818 | 71.0% |
[ 4.5% - 5.0% ] 4.57% | 2,211 | 76.7% |
[ 4.5% - 5.0% ] 4.70% | 468 | 100.0% |
[ 4.5% - 5.0% ] 4.77% | 3,104 | 54.0% |
[ 4.5% - 5.0% ] 4.96% | 746 | 36.3% |
[ 5.0% - 5.5% ] 5.21% | 6,510 | 62.7% |
[ 5.0% - 5.5% ] 5.22% | 6,500 | 83.4% |
[ 5.0% - 5.5% ] 5.30% | 736 | 73.4% |
[ 5.0% - 5.5% ] 5.47% | 676 | 96.2% |
[ 5.5% - 6.0% ] 5.56% | 1,277 | 70.3% |
[ 5.5% - 6.0% ] 5.98% | 1,271 | 79.0% |
[ 6.0% - 6.5% ] 6.34% | 347 | 69.2% |
[ 6.0% - 6.5% ] 6.42% | 1,837 | 72.4% |
[ 7.0% - 7.5% ] 7.06% | 1,883 | 63.1% |
[ 7.0% - 7.5% ] 7.30% | 1,137 | 75.9% |
[ 8.0% - 8.5% ] 8.09% | 272 | 72.2% |
[ 8.5% - 9.0% ] 8.51% | 34,860 | 69.2% |
[ 8.5% - 9.0% ] 8.92% | 2,948 | 78.8% |
[ 8.5% - 9.0% ] 8.96% | 3,851 | 37.5% |
[ 9.5% - 10.0% ] 9.54% | 31,121 | 67.3% |
[ 11.0% - 11.5% ] 11.27% | 630 | 66.8% |
[ 11.5% - 12.0% ] 11.73% | 1,202 | 56.3% |
[ 11.5% - 12.0% ] 11.98% | 4,024 | 79.4% |