Bolivian Disability Age Under 5
COMPARE
Bolivian
Select to Compare
Disability Age Under 5
Bolivian Disability Age Under 5
1.0%
DISABILITY | AGE UNDER 5
99.9/ 100
METRIC RATING
33rd/ 347
METRIC RANK
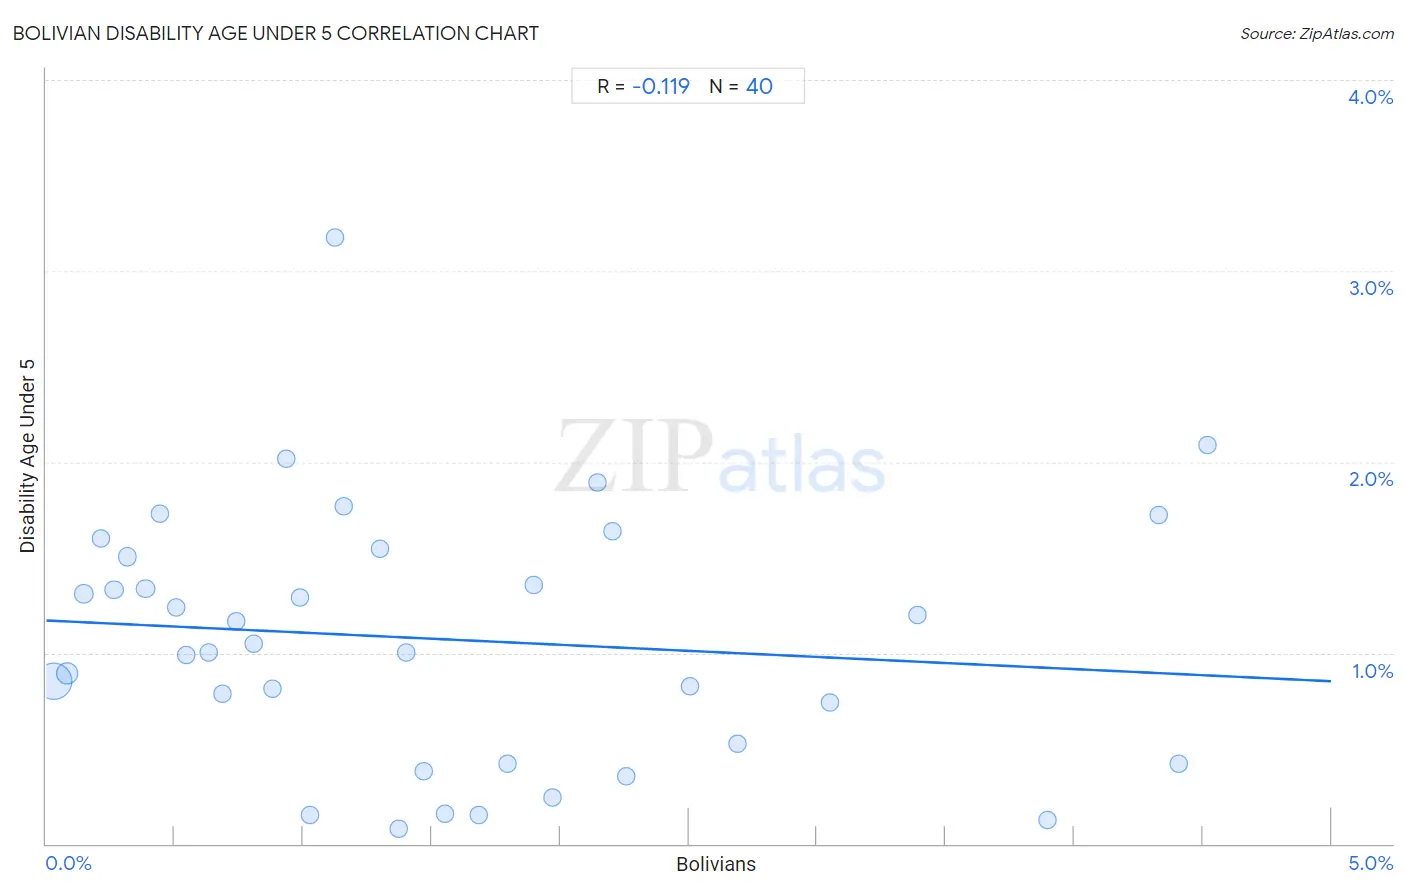
Bolivian Disability Age Under 5 Correlation Chart
The statistical analysis conducted on geographies consisting of 123,464,586 people shows a poor negative correlation between the proportion of Bolivians and percentage of population with a disability under the age of 5 in the United States with a correlation coefficient (R) of -0.119 and weighted average of 1.0%. On average, for every 1% (one percent) increase in Bolivians within a typical geography, there is a decrease of 0.064% in percentage of population with a disability under the age of 5.
It is essential to understand that the correlation between the percentage of Bolivians and percentage of population with a disability under the age of 5 does not imply a direct cause-and-effect relationship. It remains uncertain whether the presence of Bolivians influences an upward or downward trend in the level of percentage of population with a disability under the age of 5 within an area, or if Bolivians simply ended up residing in those areas with higher or lower levels of percentage of population with a disability under the age of 5 due to other factors.
Demographics Similar to Bolivians by Disability Age Under 5
In terms of disability age under 5, the demographic groups most similar to Bolivians are Immigrants from Ukraine (1.0%, a difference of 0.12%), Iranian (1.0%, a difference of 0.17%), Armenian (1.0%, a difference of 0.22%), Barbadian (1.0%, a difference of 0.36%), and Immigrants from South Central Asia (1.0%, a difference of 0.51%).
| Demographics | Rating | Rank | Disability Age Under 5 |
| Immigrants from Taiwan | 100.0 /100 | #26 | Exceptional 1.0% |
| Guyanese | 100.0 /100 | #27 | Exceptional 1.0% |
| Immigrants from Eastern Asia | 100.0 /100 | #28 | Exceptional 1.0% |
| Immigrants from Belarus | 100.0 /100 | #29 | Exceptional 1.0% |
| Immigrants from South Central Asia | 99.9 /100 | #30 | Exceptional 1.0% |
| Armenians | 99.9 /100 | #31 | Exceptional 1.0% |
| Iranians | 99.9 /100 | #32 | Exceptional 1.0% |
| Bolivians | 99.9 /100 | #33 | Exceptional 1.0% |
| Immigrants from Ukraine | 99.9 /100 | #34 | Exceptional 1.0% |
| Barbadians | 99.9 /100 | #35 | Exceptional 1.0% |
| Immigrants from Nepal | 99.9 /100 | #36 | Exceptional 1.0% |
| Immigrants from India | 99.9 /100 | #37 | Exceptional 1.0% |
| Immigrants from Guyana | 99.9 /100 | #38 | Exceptional 1.0% |
| Filipinos | 99.9 /100 | #39 | Exceptional 1.1% |
| Immigrants from Albania | 99.9 /100 | #40 | Exceptional 1.1% |
Bolivian Disability Age Under 5 Correlation Summary
| Measurement | Bolivian Data | Disability Age Under 5 Data |
| Minimum | 0.027% | 0.078% |
| Maximum | 4.5% | 3.2% |
| Range | 4.5% | 3.1% |
| Mean | 1.5% | 1.1% |
| Median | 1.2% | 1.0% |
| Interquartile 25% (IQ1) | 0.59% | 0.47% |
| Interquartile 75% (IQ3) | 2.2% | 1.5% |
| Interquartile Range (IQR) | 1.6% | 1.1% |
| Standard Deviation (Sample) | 1.2% | 0.67% |
| Standard Deviation (Population) | 1.2% | 0.66% |
Correlation Details
| Bolivian Percentile | Sample Size | Disability Age Under 5 |
[ 0.0% - 0.5% ] 0.027% | 86,806,381 | 0.85% |
[ 0.0% - 0.5% ] 0.081% | 20,422,184 | 0.89% |
[ 0.0% - 0.5% ] 0.15% | 5,079,479 | 1.3% |
[ 0.0% - 0.5% ] 0.21% | 2,799,117 | 1.6% |
[ 0.0% - 0.5% ] 0.26% | 2,280,881 | 1.3% |
[ 0.0% - 0.5% ] 0.32% | 1,217,834 | 1.5% |
[ 0.0% - 0.5% ] 0.39% | 822,110 | 1.3% |
[ 0.0% - 0.5% ] 0.44% | 767,428 | 1.7% |
[ 0.5% - 1.0% ] 0.51% | 481,595 | 1.2% |
[ 0.5% - 1.0% ] 0.55% | 251,668 | 0.99% |
[ 0.5% - 1.0% ] 0.63% | 341,403 | 1.0% |
[ 0.5% - 1.0% ] 0.69% | 62,686 | 0.79% |
[ 0.5% - 1.0% ] 0.74% | 70,435 | 1.2% |
[ 0.5% - 1.0% ] 0.81% | 217,635 | 1.0% |
[ 0.5% - 1.0% ] 0.88% | 187,164 | 0.81% |
[ 0.5% - 1.0% ] 0.93% | 154,371 | 2.0% |
[ 0.5% - 1.0% ] 0.99% | 76,599 | 1.3% |
[ 1.0% - 1.5% ] 1.03% | 37,106 | 0.15% |
[ 1.0% - 1.5% ] 1.12% | 54,896 | 3.2% |
[ 1.0% - 1.5% ] 1.16% | 91,400 | 1.8% |
[ 1.0% - 1.5% ] 1.30% | 26,322 | 1.5% |
[ 1.0% - 1.5% ] 1.37% | 44,781 | 0.078% |
[ 1.0% - 1.5% ] 1.40% | 79,020 | 1.00% |
[ 1.0% - 1.5% ] 1.47% | 263,273 | 0.38% |
[ 1.5% - 2.0% ] 1.55% | 90,210 | 0.16% |
[ 1.5% - 2.0% ] 1.68% | 44,720 | 0.15% |
[ 1.5% - 2.0% ] 1.79% | 72,680 | 0.42% |
[ 1.5% - 2.0% ] 1.90% | 68,186 | 1.4% |
[ 1.5% - 2.0% ] 1.97% | 78,542 | 0.24% |
[ 2.0% - 2.5% ] 2.14% | 10,591 | 1.9% |
[ 2.0% - 2.5% ] 2.20% | 18,007 | 1.6% |
[ 2.0% - 2.5% ] 2.26% | 73,928 | 0.35% |
[ 2.5% - 3.0% ] 2.51% | 14,042 | 0.83% |
[ 2.5% - 3.0% ] 2.69% | 83,796 | 0.53% |
[ 3.0% - 3.5% ] 3.05% | 24,785 | 0.74% |
[ 3.0% - 3.5% ] 3.39% | 95,511 | 1.2% |
[ 3.5% - 4.0% ] 3.90% | 52,359 | 0.13% |
[ 4.0% - 4.5% ] 4.33% | 46,313 | 1.7% |
[ 4.0% - 4.5% ] 4.41% | 42,330 | 0.42% |
[ 4.5% - 5.0% ] 4.52% | 12,818 | 2.1% |