Barbadian 2 or more Vehicles in Household
COMPARE
Barbadian
Select to Compare
2 or more Vehicles in Household
Barbadian 2 or more Vehicles in Household
38.3%
2+ VEHICLES AVAILABLE
0.0/ 100
METRIC RATING
337th/ 347
METRIC RANK
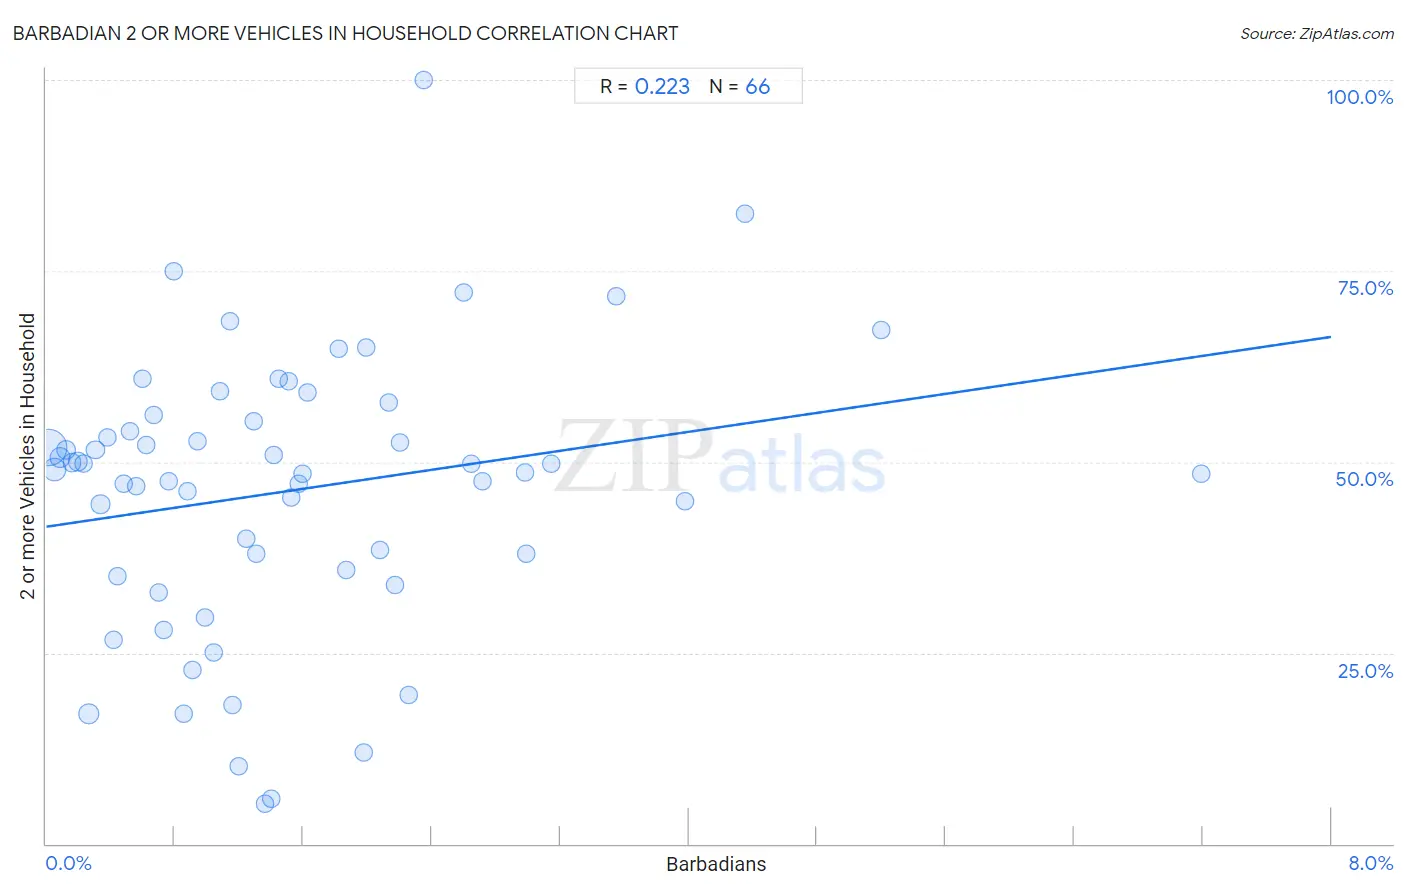
Barbadian 2 or more Vehicles in Household Correlation Chart
The statistical analysis conducted on geographies consisting of 141,285,511 people shows a weak positive correlation between the proportion of Barbadians and percentage of households with 2 or more vehicles available in the United States with a correlation coefficient (R) of 0.223 and weighted average of 38.3%. On average, for every 1% (one percent) increase in Barbadians within a typical geography, there is an increase of 3.1% in percentage of households with 2 or more vehicles available.
It is essential to understand that the correlation between the percentage of Barbadians and percentage of households with 2 or more vehicles available does not imply a direct cause-and-effect relationship. It remains uncertain whether the presence of Barbadians influences an upward or downward trend in the level of percentage of households with 2 or more vehicles available within an area, or if Barbadians simply ended up residing in those areas with higher or lower levels of percentage of households with 2 or more vehicles available due to other factors.
Demographics Similar to Barbadians by 2 or more Vehicles in Household
In terms of 2 or more vehicles in household, the demographic groups most similar to Barbadians are Vietnamese (38.5%, a difference of 0.41%), Immigrants from Bangladesh (38.8%, a difference of 1.1%), Immigrants from Uzbekistan (37.9%, a difference of 1.2%), Immigrants from Trinidad and Tobago (40.3%, a difference of 5.0%), and Immigrants from Ecuador (40.5%, a difference of 5.6%).
| Demographics | Rating | Rank | 2 or more Vehicles in Household |
| Immigrants from Dominica | 0.0 /100 | #330 | Tragic 41.6% |
| West Indians | 0.0 /100 | #331 | Tragic 41.3% |
| Trinidadians and Tobagonians | 0.0 /100 | #332 | Tragic 40.9% |
| Immigrants from Ecuador | 0.0 /100 | #333 | Tragic 40.5% |
| Immigrants from Trinidad and Tobago | 0.0 /100 | #334 | Tragic 40.3% |
| Immigrants from Bangladesh | 0.0 /100 | #335 | Tragic 38.8% |
| Vietnamese | 0.0 /100 | #336 | Tragic 38.5% |
| Barbadians | 0.0 /100 | #337 | Tragic 38.3% |
| Immigrants from Uzbekistan | 0.0 /100 | #338 | Tragic 37.9% |
| Immigrants from Barbados | 0.0 /100 | #339 | Tragic 35.8% |
| British West Indians | 0.0 /100 | #340 | Tragic 35.4% |
| Guyanese | 0.0 /100 | #341 | Tragic 35.4% |
| Dominicans | 0.0 /100 | #342 | Tragic 35.3% |
| Immigrants from Guyana | 0.0 /100 | #343 | Tragic 35.0% |
| Yup'ik | 0.0 /100 | #344 | Tragic 34.9% |
Barbadian 2 or more Vehicles in Household Correlation Summary
| Measurement | Barbadian Data | 2 or more Vehicles in Household Data |
| Minimum | 0.013% | 5.2% |
| Maximum | 7.2% | 100.0% |
| Range | 7.2% | 94.8% |
| Mean | 1.5% | 46.2% |
| Median | 1.2% | 48.8% |
| Interquartile 25% (IQ1) | 0.60% | 35.8% |
| Interquartile 75% (IQ3) | 2.1% | 55.4% |
| Interquartile Range (IQR) | 1.5% | 19.6% |
| Standard Deviation (Sample) | 1.3% | 18.2% |
| Standard Deviation (Population) | 1.3% | 18.0% |
Correlation Details
| Barbadian Percentile | Sample Size | 2 or more Vehicles in Household |
[ 0.0% - 0.5% ] 0.013% | 76,138,041 | 51.9% |
[ 0.0% - 0.5% ] 0.051% | 23,784,059 | 49.0% |
[ 0.0% - 0.5% ] 0.089% | 9,475,488 | 50.6% |
[ 0.0% - 0.5% ] 0.12% | 5,890,911 | 51.5% |
[ 0.0% - 0.5% ] 0.16% | 4,076,214 | 49.9% |
[ 0.0% - 0.5% ] 0.20% | 2,638,890 | 50.0% |
[ 0.0% - 0.5% ] 0.23% | 1,469,748 | 49.8% |
[ 0.0% - 0.5% ] 0.26% | 9,714,011 | 17.1% |
[ 0.0% - 0.5% ] 0.31% | 1,519,112 | 51.6% |
[ 0.0% - 0.5% ] 0.34% | 880,879 | 44.5% |
[ 0.0% - 0.5% ] 0.38% | 529,253 | 53.1% |
[ 0.0% - 0.5% ] 0.42% | 1,120,583 | 26.6% |
[ 0.0% - 0.5% ] 0.44% | 416,597 | 35.0% |
[ 0.0% - 0.5% ] 0.48% | 336,674 | 47.2% |
[ 0.5% - 1.0% ] 0.52% | 216,639 | 54.0% |
[ 0.5% - 1.0% ] 0.56% | 406,015 | 46.8% |
[ 0.5% - 1.0% ] 0.60% | 144,907 | 60.8% |
[ 0.5% - 1.0% ] 0.63% | 108,970 | 52.3% |
[ 0.5% - 1.0% ] 0.67% | 29,992 | 56.1% |
[ 0.5% - 1.0% ] 0.70% | 228,074 | 32.9% |
[ 0.5% - 1.0% ] 0.73% | 237,722 | 28.0% |
[ 0.5% - 1.0% ] 0.77% | 180,637 | 47.5% |
[ 0.5% - 1.0% ] 0.80% | 6,660 | 75.0% |
[ 0.5% - 1.0% ] 0.85% | 177,303 | 17.1% |
[ 0.5% - 1.0% ] 0.88% | 100,960 | 46.2% |
[ 0.5% - 1.0% ] 0.91% | 308,004 | 22.8% |
[ 0.5% - 1.0% ] 0.94% | 114,272 | 52.7% |
[ 0.5% - 1.0% ] 0.99% | 94,016 | 29.6% |
[ 1.0% - 1.5% ] 1.05% | 31,730 | 25.1% |
[ 1.0% - 1.5% ] 1.08% | 16,909 | 59.3% |
[ 1.0% - 1.5% ] 1.14% | 1,138 | 68.3% |
[ 1.0% - 1.5% ] 1.16% | 182,406 | 18.2% |
[ 1.0% - 1.5% ] 1.20% | 86,343 | 10.1% |
[ 1.0% - 1.5% ] 1.24% | 45,908 | 39.9% |
[ 1.0% - 1.5% ] 1.29% | 4,650 | 55.4% |
[ 1.0% - 1.5% ] 1.31% | 10,526 | 38.0% |
[ 1.0% - 1.5% ] 1.36% | 69,131 | 5.2% |
[ 1.0% - 1.5% ] 1.40% | 58,476 | 5.9% |
[ 1.0% - 1.5% ] 1.42% | 12,927 | 51.0% |
[ 1.0% - 1.5% ] 1.45% | 2,551 | 60.8% |
[ 1.5% - 2.0% ] 1.51% | 1,590 | 60.6% |
[ 1.5% - 2.0% ] 1.52% | 984 | 45.3% |
[ 1.5% - 2.0% ] 1.57% | 10,631 | 47.2% |
[ 1.5% - 2.0% ] 1.59% | 10,482 | 48.5% |
[ 1.5% - 2.0% ] 1.63% | 22,620 | 59.1% |
[ 1.5% - 2.0% ] 1.82% | 24,044 | 64.8% |
[ 1.5% - 2.0% ] 1.87% | 27,590 | 35.8% |
[ 1.5% - 2.0% ] 1.97% | 78,506 | 12.0% |
[ 1.5% - 2.0% ] 1.99% | 553 | 65.0% |
[ 2.0% - 2.5% ] 2.08% | 3,222 | 38.5% |
[ 2.0% - 2.5% ] 2.13% | 7,412 | 57.7% |
[ 2.0% - 2.5% ] 2.17% | 55,336 | 33.8% |
[ 2.0% - 2.5% ] 2.20% | 9,124 | 52.6% |
[ 2.0% - 2.5% ] 2.25% | 100,082 | 19.5% |
[ 2.0% - 2.5% ] 2.35% | 468 | 100.0% |
[ 2.5% - 3.0% ] 2.60% | 14,172 | 72.1% |
[ 2.5% - 3.0% ] 2.64% | 5,373 | 49.8% |
[ 2.5% - 3.0% ] 2.72% | 6,108 | 47.5% |
[ 2.5% - 3.0% ] 2.98% | 4,703 | 48.6% |
[ 2.5% - 3.0% ] 2.99% | 134 | 38.0% |
[ 3.0% - 3.5% ] 3.14% | 23,119 | 49.8% |
[ 3.5% - 4.0% ] 3.55% | 338 | 71.7% |
[ 3.5% - 4.0% ] 3.98% | 8,620 | 44.8% |
[ 4.0% - 4.5% ] 4.35% | 1,035 | 82.4% |
[ 5.0% - 5.5% ] 5.20% | 173 | 67.3% |
[ 7.0% - 7.5% ] 7.19% | 1,766 | 48.4% |