Barbadian Self-Care Disability
COMPARE
Barbadian
Select to Compare
Self-Care Disability
Barbadian Self-Care Disability
2.7%
SELF-CARE DISABILITY
0.0/ 100
METRIC RATING
295th/ 347
METRIC RANK
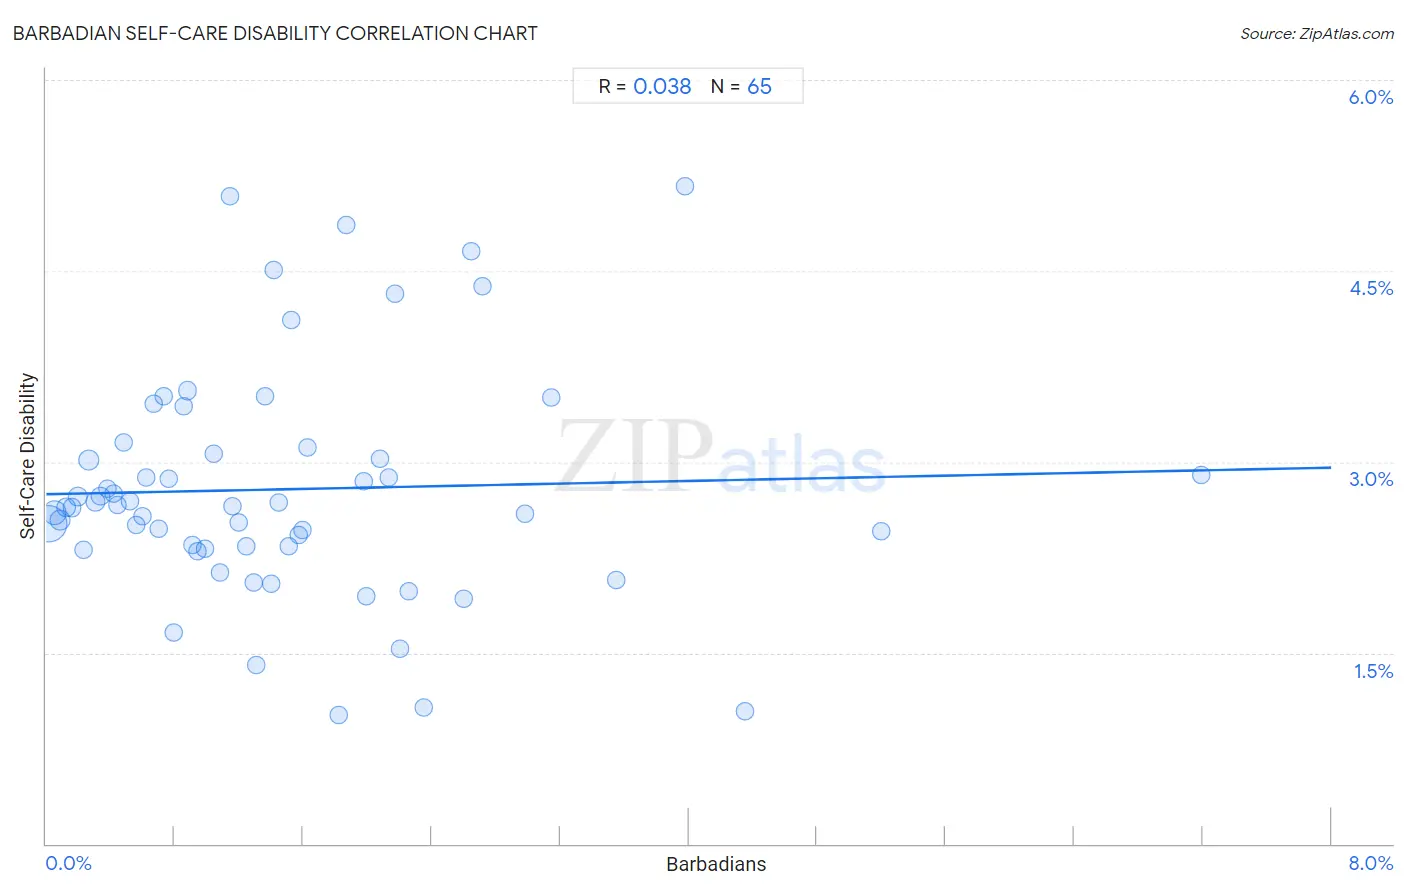
Barbadian Self-Care Disability Correlation Chart
The statistical analysis conducted on geographies consisting of 141,243,740 people shows no correlation between the proportion of Barbadians and percentage of population with self-care disability in the United States with a correlation coefficient (R) of 0.038 and weighted average of 2.7%. On average, for every 1% (one percent) increase in Barbadians within a typical geography, there is an increase of 0.026% in percentage of population with self-care disability.
It is essential to understand that the correlation between the percentage of Barbadians and percentage of population with self-care disability does not imply a direct cause-and-effect relationship. It remains uncertain whether the presence of Barbadians influences an upward or downward trend in the level of percentage of population with self-care disability within an area, or if Barbadians simply ended up residing in those areas with higher or lower levels of percentage of population with self-care disability due to other factors.
Demographics Similar to Barbadians by Self-Care Disability
In terms of self-care disability, the demographic groups most similar to Barbadians are Blackfeet (2.7%, a difference of 0.14%), Central American Indian (2.7%, a difference of 0.15%), Belizean (2.7%, a difference of 0.15%), Guyanese (2.7%, a difference of 0.31%), and Immigrants from Portugal (2.8%, a difference of 0.43%).
| Demographics | Rating | Rank | Self-Care Disability |
| Immigrants from Barbados | 0.0 /100 | #288 | Tragic 2.7% |
| Africans | 0.0 /100 | #289 | Tragic 2.7% |
| Cubans | 0.0 /100 | #290 | Tragic 2.7% |
| Guyanese | 0.0 /100 | #291 | Tragic 2.7% |
| Central American Indians | 0.0 /100 | #292 | Tragic 2.7% |
| Belizeans | 0.0 /100 | #293 | Tragic 2.7% |
| Blackfeet | 0.0 /100 | #294 | Tragic 2.7% |
| Barbadians | 0.0 /100 | #295 | Tragic 2.7% |
| Immigrants from Portugal | 0.0 /100 | #296 | Tragic 2.8% |
| West Indians | 0.0 /100 | #297 | Tragic 2.8% |
| Americans | 0.0 /100 | #298 | Tragic 2.8% |
| Immigrants from Guyana | 0.0 /100 | #299 | Tragic 2.8% |
| Immigrants from Fiji | 0.0 /100 | #300 | Tragic 2.8% |
| Pima | 0.0 /100 | #301 | Tragic 2.8% |
| Immigrants from St. Vincent and the Grenadines | 0.0 /100 | #302 | Tragic 2.8% |
Barbadian Self-Care Disability Correlation Summary
| Measurement | Barbadian Data | Self-Care Disability Data |
| Minimum | 0.013% | 1.0% |
| Maximum | 7.2% | 5.2% |
| Range | 7.2% | 4.2% |
| Mean | 1.5% | 2.8% |
| Median | 1.2% | 2.7% |
| Interquartile 25% (IQ1) | 0.58% | 2.3% |
| Interquartile 75% (IQ3) | 2.0% | 3.1% |
| Interquartile Range (IQR) | 1.5% | 0.76% |
| Standard Deviation (Sample) | 1.3% | 0.90% |
| Standard Deviation (Population) | 1.3% | 0.90% |
Correlation Details
| Barbadian Percentile | Sample Size | Self-Care Disability |
[ 0.0% - 0.5% ] 0.013% | 76,138,041 | 2.5% |
[ 0.0% - 0.5% ] 0.051% | 23,775,455 | 2.6% |
[ 0.0% - 0.5% ] 0.089% | 9,466,681 | 2.5% |
[ 0.0% - 0.5% ] 0.12% | 5,878,922 | 2.6% |
[ 0.0% - 0.5% ] 0.16% | 4,076,214 | 2.6% |
[ 0.0% - 0.5% ] 0.20% | 2,638,890 | 2.7% |
[ 0.0% - 0.5% ] 0.23% | 1,464,763 | 2.3% |
[ 0.0% - 0.5% ] 0.26% | 9,714,011 | 3.0% |
[ 0.0% - 0.5% ] 0.31% | 1,519,112 | 2.7% |
[ 0.0% - 0.5% ] 0.34% | 880,879 | 2.7% |
[ 0.0% - 0.5% ] 0.38% | 529,253 | 2.8% |
[ 0.0% - 0.5% ] 0.42% | 1,120,583 | 2.7% |
[ 0.0% - 0.5% ] 0.44% | 416,597 | 2.7% |
[ 0.0% - 0.5% ] 0.48% | 336,674 | 3.2% |
[ 0.5% - 1.0% ] 0.52% | 214,550 | 2.7% |
[ 0.5% - 1.0% ] 0.56% | 406,015 | 2.5% |
[ 0.5% - 1.0% ] 0.60% | 144,907 | 2.6% |
[ 0.5% - 1.0% ] 0.63% | 108,970 | 2.9% |
[ 0.5% - 1.0% ] 0.67% | 29,992 | 3.5% |
[ 0.5% - 1.0% ] 0.70% | 225,487 | 2.5% |
[ 0.5% - 1.0% ] 0.73% | 235,146 | 3.5% |
[ 0.5% - 1.0% ] 0.77% | 180,637 | 2.9% |
[ 0.5% - 1.0% ] 0.80% | 6,660 | 1.7% |
[ 0.5% - 1.0% ] 0.85% | 177,303 | 3.4% |
[ 0.5% - 1.0% ] 0.88% | 100,960 | 3.6% |
[ 0.5% - 1.0% ] 0.91% | 308,004 | 2.4% |
[ 0.5% - 1.0% ] 0.94% | 114,272 | 2.3% |
[ 0.5% - 1.0% ] 0.99% | 94,016 | 2.3% |
[ 1.0% - 1.5% ] 1.05% | 31,730 | 3.1% |
[ 1.0% - 1.5% ] 1.08% | 16,909 | 2.1% |
[ 1.0% - 1.5% ] 1.14% | 1,138 | 5.1% |
[ 1.0% - 1.5% ] 1.16% | 182,406 | 2.7% |
[ 1.0% - 1.5% ] 1.20% | 86,343 | 2.5% |
[ 1.0% - 1.5% ] 1.24% | 45,908 | 2.3% |
[ 1.0% - 1.5% ] 1.29% | 4,650 | 2.1% |
[ 1.0% - 1.5% ] 1.31% | 10,526 | 1.4% |
[ 1.0% - 1.5% ] 1.36% | 69,131 | 3.5% |
[ 1.0% - 1.5% ] 1.40% | 58,476 | 2.0% |
[ 1.0% - 1.5% ] 1.42% | 12,927 | 4.5% |
[ 1.0% - 1.5% ] 1.45% | 2,551 | 2.7% |
[ 1.5% - 2.0% ] 1.51% | 1,590 | 2.3% |
[ 1.5% - 2.0% ] 1.52% | 984 | 4.1% |
[ 1.5% - 2.0% ] 1.57% | 10,631 | 2.4% |
[ 1.5% - 2.0% ] 1.59% | 10,482 | 2.5% |
[ 1.5% - 2.0% ] 1.63% | 22,620 | 3.1% |
[ 1.5% - 2.0% ] 1.82% | 24,044 | 1.0% |
[ 1.5% - 2.0% ] 1.87% | 27,590 | 4.9% |
[ 1.5% - 2.0% ] 1.97% | 78,506 | 2.9% |
[ 1.5% - 2.0% ] 1.99% | 553 | 1.9% |
[ 2.0% - 2.5% ] 2.08% | 3,222 | 3.0% |
[ 2.0% - 2.5% ] 2.13% | 7,412 | 2.9% |
[ 2.0% - 2.5% ] 2.17% | 55,336 | 4.3% |
[ 2.0% - 2.5% ] 2.20% | 9,124 | 1.5% |
[ 2.0% - 2.5% ] 2.25% | 100,082 | 2.0% |
[ 2.0% - 2.5% ] 2.35% | 468 | 1.1% |
[ 2.5% - 3.0% ] 2.60% | 14,172 | 1.9% |
[ 2.5% - 3.0% ] 2.64% | 5,373 | 4.7% |
[ 2.5% - 3.0% ] 2.72% | 6,108 | 4.4% |
[ 2.5% - 3.0% ] 2.98% | 4,703 | 2.6% |
[ 3.0% - 3.5% ] 3.14% | 23,119 | 3.5% |
[ 3.5% - 4.0% ] 3.55% | 338 | 2.1% |
[ 3.5% - 4.0% ] 3.98% | 8,620 | 5.2% |
[ 4.0% - 4.5% ] 4.35% | 1,035 | 1.0% |
[ 5.0% - 5.5% ] 5.20% | 173 | 2.5% |
[ 7.0% - 7.5% ] 7.19% | 1,766 | 2.9% |