Barbadian vs Cherokee Married-Couple Family Poverty
COMPARE
Barbadian
Cherokee
Married-Couple Family Poverty
Married-Couple Family Poverty Comparison
Barbadians
Cherokee
6.3%
MARRIED-COUPLE FAMILY POVERTY
0.1/ 100
METRIC RATING
274th/ 347
METRIC RANK
5.8%
MARRIED-COUPLE FAMILY POVERTY
2.7/ 100
METRIC RATING
238th/ 347
METRIC RANK
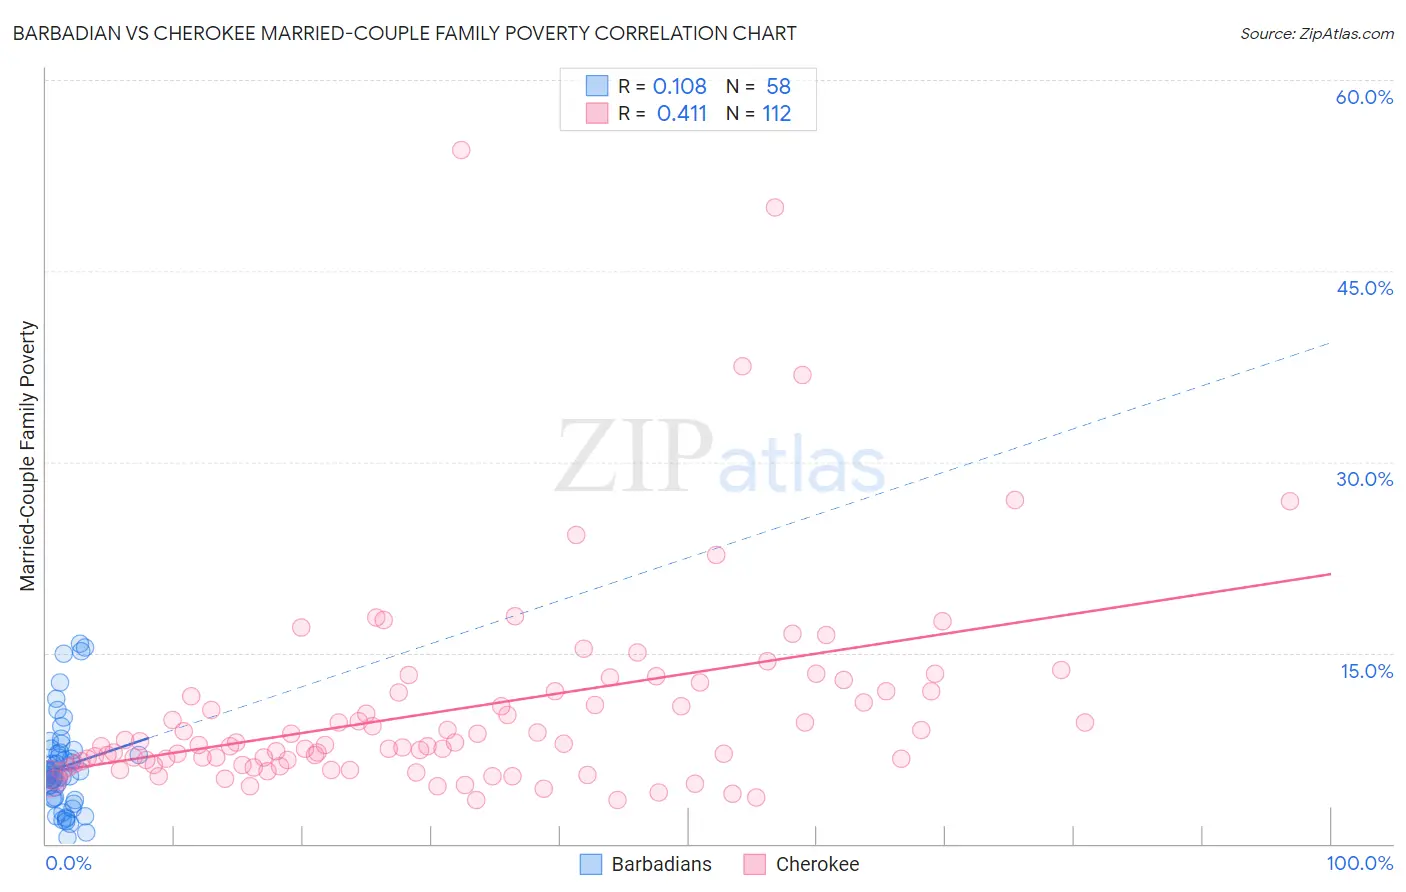
Barbadian vs Cherokee Married-Couple Family Poverty Correlation Chart
The statistical analysis conducted on geographies consisting of 140,986,203 people shows a poor positive correlation between the proportion of Barbadians and poverty level among married-couple families in the United States with a correlation coefficient (R) of 0.108 and weighted average of 6.3%. Similarly, the statistical analysis conducted on geographies consisting of 487,541,023 people shows a moderate positive correlation between the proportion of Cherokee and poverty level among married-couple families in the United States with a correlation coefficient (R) of 0.411 and weighted average of 5.8%, a difference of 9.0%.
Married-Couple Family Poverty Correlation Summary
| Measurement | Barbadian | Cherokee |
| Minimum | 0.52% | 3.4% |
| Maximum | 15.7% | 54.5% |
| Range | 15.2% | 51.1% |
| Mean | 6.0% | 10.6% |
| Median | 5.5% | 7.7% |
| Interquartile 25% (IQ1) | 3.5% | 6.2% |
| Interquartile 75% (IQ3) | 7.2% | 12.0% |
| Interquartile Range (IQR) | 3.7% | 5.8% |
| Standard Deviation (Sample) | 3.6% | 8.2% |
| Standard Deviation (Population) | 3.5% | 8.2% |
Similar Demographics by Married-Couple Family Poverty
Demographics Similar to Barbadians by Married-Couple Family Poverty
In terms of married-couple family poverty, the demographic groups most similar to Barbadians are Colville (6.3%, a difference of 0.050%), Choctaw (6.3%, a difference of 0.16%), Yaqui (6.3%, a difference of 0.62%), Indonesian (6.3%, a difference of 0.75%), and Trinidadian and Tobagonian (6.2%, a difference of 0.83%).
| Demographics | Rating | Rank | Married-Couple Family Poverty |
| Spanish Americans | 0.2 /100 | #267 | Tragic 6.2% |
| Alaska Natives | 0.2 /100 | #268 | Tragic 6.2% |
| Immigrants | West Indies | 0.1 /100 | #269 | Tragic 6.2% |
| Immigrants | Jamaica | 0.1 /100 | #270 | Tragic 6.2% |
| Immigrants | Bahamas | 0.1 /100 | #271 | Tragic 6.2% |
| Trinidadians and Tobagonians | 0.1 /100 | #272 | Tragic 6.2% |
| Colville | 0.1 /100 | #273 | Tragic 6.3% |
| Barbadians | 0.1 /100 | #274 | Tragic 6.3% |
| Choctaw | 0.1 /100 | #275 | Tragic 6.3% |
| Yaqui | 0.1 /100 | #276 | Tragic 6.3% |
| Indonesians | 0.1 /100 | #277 | Tragic 6.3% |
| Immigrants | Trinidad and Tobago | 0.1 /100 | #278 | Tragic 6.4% |
| Houma | 0.0 /100 | #279 | Tragic 6.4% |
| West Indians | 0.0 /100 | #280 | Tragic 6.4% |
| Mexican American Indians | 0.0 /100 | #281 | Tragic 6.4% |
Demographics Similar to Cherokee by Married-Couple Family Poverty
In terms of married-couple family poverty, the demographic groups most similar to Cherokee are Venezuelan (5.8%, a difference of 0.020%), Fijian (5.8%, a difference of 0.19%), Immigrants from Panama (5.8%, a difference of 0.22%), Immigrants from Western Africa (5.8%, a difference of 0.31%), and Immigrants from South America (5.7%, a difference of 0.38%).
| Demographics | Rating | Rank | Married-Couple Family Poverty |
| Immigrants | Iraq | 4.4 /100 | #231 | Tragic 5.7% |
| Immigrants | Laos | 4.4 /100 | #232 | Tragic 5.7% |
| Immigrants | Colombia | 3.7 /100 | #233 | Tragic 5.7% |
| Immigrants | Uruguay | 3.7 /100 | #234 | Tragic 5.7% |
| Immigrants | Sudan | 3.5 /100 | #235 | Tragic 5.7% |
| Ghanaians | 3.3 /100 | #236 | Tragic 5.7% |
| Immigrants | South America | 3.1 /100 | #237 | Tragic 5.7% |
| Cherokee | 2.7 /100 | #238 | Tragic 5.8% |
| Venezuelans | 2.7 /100 | #239 | Tragic 5.8% |
| Fijians | 2.5 /100 | #240 | Tragic 5.8% |
| Immigrants | Panama | 2.5 /100 | #241 | Tragic 5.8% |
| Immigrants | Western Africa | 2.4 /100 | #242 | Tragic 5.8% |
| Somalis | 2.3 /100 | #243 | Tragic 5.8% |
| Chickasaw | 2.3 /100 | #244 | Tragic 5.8% |
| Immigrants | Afghanistan | 2.1 /100 | #245 | Tragic 5.8% |