Barbadian Disability
COMPARE
Barbadian
Select to Compare
Disability
Barbadian Disability
11.9%
DISABILITY
15.8/ 100
METRIC RATING
195th/ 347
METRIC RANK
Barbadian Disability Correlation Chart
The statistical analysis conducted on geographies consisting of 141,302,135 people shows a mild positive correlation between the proportion of Barbadians and percentage of population with a disability in the United States with a correlation coefficient (R) of 0.371 and weighted average of 11.9%. On average, for every 1% (one percent) increase in Barbadians within a typical geography, there is an increase of 1.0% in percentage of population with a disability.
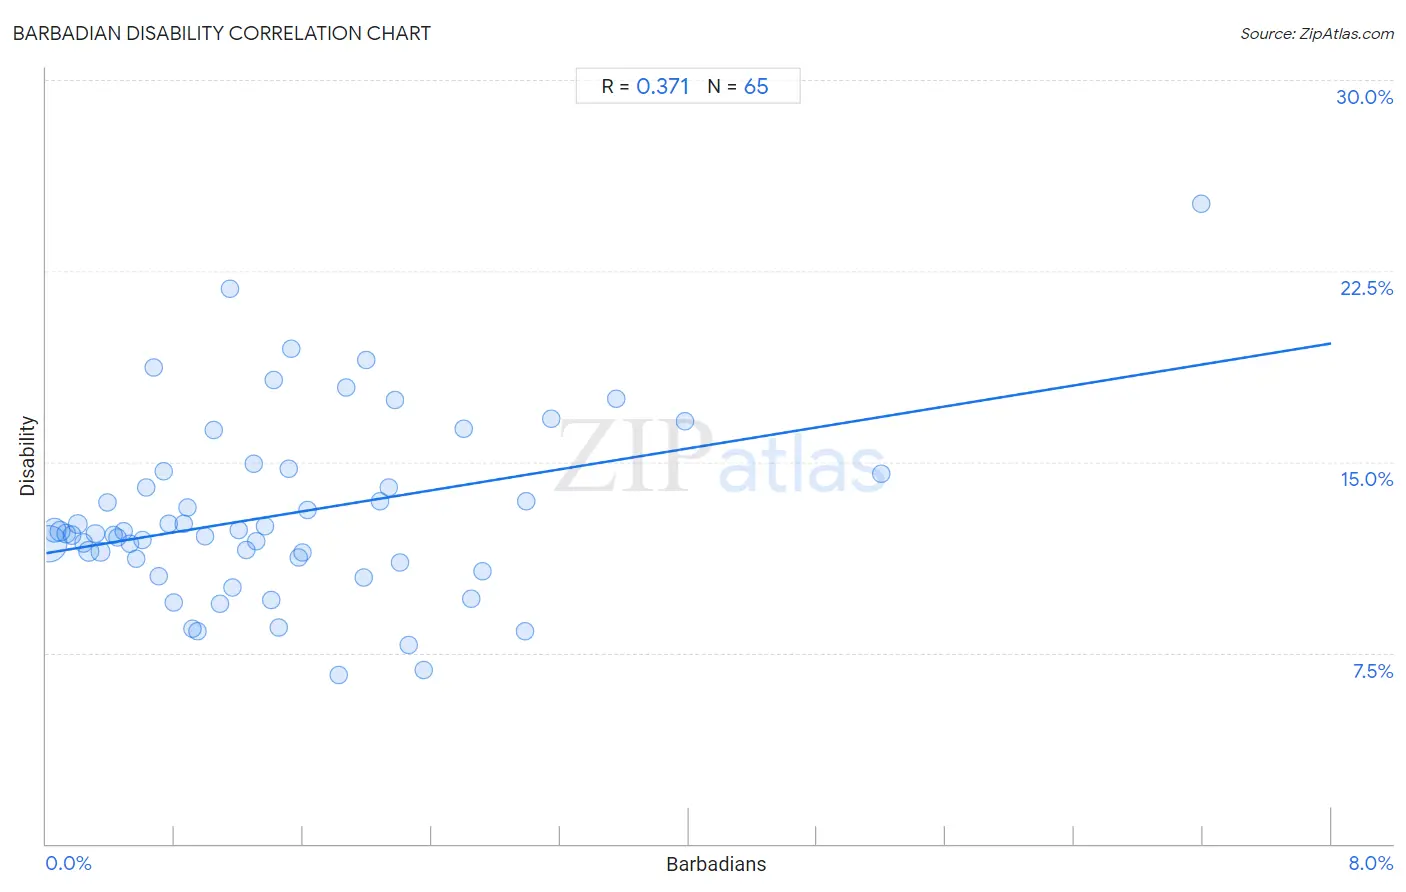
It is essential to understand that the correlation between the percentage of Barbadians and percentage of population with a disability does not imply a direct cause-and-effect relationship. It remains uncertain whether the presence of Barbadians influences an upward or downward trend in the level of percentage of population with a disability within an area, or if Barbadians simply ended up residing in those areas with higher or lower levels of percentage of population with a disability due to other factors.
Demographics Similar to Barbadians by Disability
In terms of disability, the demographic groups most similar to Barbadians are Serbian (11.9%, a difference of 0.040%), Immigrants from Belize (11.9%, a difference of 0.050%), Ukrainian (11.9%, a difference of 0.10%), Immigrants from Panama (11.9%, a difference of 0.10%), and Somali (11.9%, a difference of 0.11%).
| Demographics | Rating | Rank | Disability |
| Immigrants from Mexico | 23.8 /100 | #188 | Fair 11.9% |
| Immigrants from Zaire | 21.8 /100 | #189 | Fair 11.9% |
| Immigrants from West Indies | 21.1 /100 | #190 | Fair 11.9% |
| Ute | 19.5 /100 | #191 | Poor 11.9% |
| Lithuanians | 18.8 /100 | #192 | Poor 11.9% |
| Immigrants from Bosnia and Herzegovina | 18.0 /100 | #193 | Poor 11.9% |
| Somalis | 17.3 /100 | #194 | Poor 11.9% |
| Barbadians | 15.8 /100 | #195 | Poor 11.9% |
| Serbians | 15.4 /100 | #196 | Poor 11.9% |
| Immigrants from Belize | 15.2 /100 | #197 | Poor 11.9% |
| Ukrainians | 14.7 /100 | #198 | Poor 11.9% |
| Immigrants from Panama | 14.6 /100 | #199 | Poor 11.9% |
| Belizeans | 12.8 /100 | #200 | Poor 11.9% |
| Assyrians/Chaldeans/Syriacs | 12.6 /100 | #201 | Poor 11.9% |
| Immigrants from England | 12.0 /100 | #202 | Poor 12.0% |
Barbadian Disability Correlation Summary
| Measurement | Barbadian Data | Disability Data |
| Minimum | 0.013% | 6.6% |
| Maximum | 7.2% | 25.1% |
| Range | 7.2% | 18.5% |
| Mean | 1.5% | 12.9% |
| Median | 1.2% | 12.2% |
| Interquartile 25% (IQ1) | 0.58% | 11.1% |
| Interquartile 75% (IQ3) | 2.0% | 14.6% |
| Interquartile Range (IQR) | 1.5% | 3.4% |
| Standard Deviation (Sample) | 1.3% | 3.5% |
| Standard Deviation (Population) | 1.3% | 3.5% |
Correlation Details
| Barbadian Percentile | Sample Size | Disability |
[ 0.0% - 0.5% ] 0.013% | 76,138,041 | 11.8% |
[ 0.0% - 0.5% ] 0.051% | 23,784,059 | 12.3% |
[ 0.0% - 0.5% ] 0.089% | 9,475,488 | 12.3% |
[ 0.0% - 0.5% ] 0.12% | 5,890,911 | 12.2% |
[ 0.0% - 0.5% ] 0.16% | 4,078,601 | 12.1% |
[ 0.0% - 0.5% ] 0.20% | 2,640,311 | 12.6% |
[ 0.0% - 0.5% ] 0.23% | 1,469,748 | 11.8% |
[ 0.0% - 0.5% ] 0.26% | 9,714,011 | 11.5% |
[ 0.0% - 0.5% ] 0.31% | 1,522,450 | 12.2% |
[ 0.0% - 0.5% ] 0.34% | 883,171 | 11.5% |
[ 0.0% - 0.5% ] 0.38% | 533,312 | 13.4% |
[ 0.0% - 0.5% ] 0.42% | 1,120,583 | 12.1% |
[ 0.0% - 0.5% ] 0.44% | 418,581 | 12.1% |
[ 0.0% - 0.5% ] 0.48% | 336,674 | 12.3% |
[ 0.5% - 1.0% ] 0.52% | 216,639 | 11.8% |
[ 0.5% - 1.0% ] 0.56% | 406,015 | 11.2% |
[ 0.5% - 1.0% ] 0.60% | 144,907 | 11.9% |
[ 0.5% - 1.0% ] 0.63% | 108,970 | 14.0% |
[ 0.5% - 1.0% ] 0.67% | 31,643 | 18.7% |
[ 0.5% - 1.0% ] 0.70% | 228,074 | 10.5% |
[ 0.5% - 1.0% ] 0.73% | 237,722 | 14.6% |
[ 0.5% - 1.0% ] 0.77% | 180,637 | 12.6% |
[ 0.5% - 1.0% ] 0.80% | 6,660 | 9.5% |
[ 0.5% - 1.0% ] 0.85% | 177,303 | 12.6% |
[ 0.5% - 1.0% ] 0.88% | 100,960 | 13.2% |
[ 0.5% - 1.0% ] 0.91% | 308,004 | 8.4% |
[ 0.5% - 1.0% ] 0.94% | 114,272 | 8.4% |
[ 0.5% - 1.0% ] 0.99% | 94,016 | 12.1% |
[ 1.0% - 1.5% ] 1.05% | 31,730 | 16.3% |
[ 1.0% - 1.5% ] 1.08% | 16,909 | 9.4% |
[ 1.0% - 1.5% ] 1.14% | 1,138 | 21.8% |
[ 1.0% - 1.5% ] 1.16% | 182,406 | 10.1% |
[ 1.0% - 1.5% ] 1.20% | 86,343 | 12.3% |
[ 1.0% - 1.5% ] 1.24% | 45,908 | 11.5% |
[ 1.0% - 1.5% ] 1.29% | 4,650 | 14.9% |
[ 1.0% - 1.5% ] 1.31% | 10,526 | 11.9% |
[ 1.0% - 1.5% ] 1.36% | 69,131 | 12.5% |
[ 1.0% - 1.5% ] 1.40% | 58,476 | 9.6% |
[ 1.0% - 1.5% ] 1.42% | 12,927 | 18.2% |
[ 1.0% - 1.5% ] 1.45% | 2,551 | 8.5% |
[ 1.5% - 2.0% ] 1.51% | 1,590 | 14.7% |
[ 1.5% - 2.0% ] 1.52% | 1,511 | 19.5% |
[ 1.5% - 2.0% ] 1.57% | 10,631 | 11.3% |
[ 1.5% - 2.0% ] 1.59% | 10,482 | 11.4% |
[ 1.5% - 2.0% ] 1.63% | 22,620 | 13.1% |
[ 1.5% - 2.0% ] 1.82% | 24,044 | 6.6% |
[ 1.5% - 2.0% ] 1.87% | 27,590 | 17.9% |
[ 1.5% - 2.0% ] 1.97% | 78,506 | 10.5% |
[ 1.5% - 2.0% ] 1.99% | 553 | 19.0% |
[ 2.0% - 2.5% ] 2.08% | 3,222 | 13.4% |
[ 2.0% - 2.5% ] 2.13% | 7,412 | 14.0% |
[ 2.0% - 2.5% ] 2.17% | 55,336 | 17.4% |
[ 2.0% - 2.5% ] 2.20% | 9,124 | 11.0% |
[ 2.0% - 2.5% ] 2.25% | 100,082 | 7.8% |
[ 2.0% - 2.5% ] 2.35% | 468 | 6.8% |
[ 2.5% - 3.0% ] 2.60% | 14,172 | 16.3% |
[ 2.5% - 3.0% ] 2.64% | 5,373 | 9.6% |
[ 2.5% - 3.0% ] 2.72% | 6,108 | 10.7% |
[ 2.5% - 3.0% ] 2.98% | 4,703 | 8.3% |
[ 2.5% - 3.0% ] 2.99% | 134 | 13.4% |
[ 3.0% - 3.5% ] 3.14% | 23,119 | 16.7% |
[ 3.5% - 4.0% ] 3.55% | 338 | 17.5% |
[ 3.5% - 4.0% ] 3.98% | 8,620 | 16.6% |
[ 5.0% - 5.5% ] 5.20% | 173 | 14.5% |
[ 7.0% - 7.5% ] 7.19% | 1,766 | 25.1% |