Barbadian Unemployment Among Women with Children Ages 6 to 17 years
COMPARE
Barbadian
Select to Compare
Unemployment Among Women with Children Ages 6 to 17 years
Barbadian Unemployment Among Women with Children Ages 6 to 17 years
8.7%
UNEMPLOYMENT | WOMEN W/ CHILDREN 6 TO 17
93.8/ 100
METRIC RATING
129th/ 347
METRIC RANK
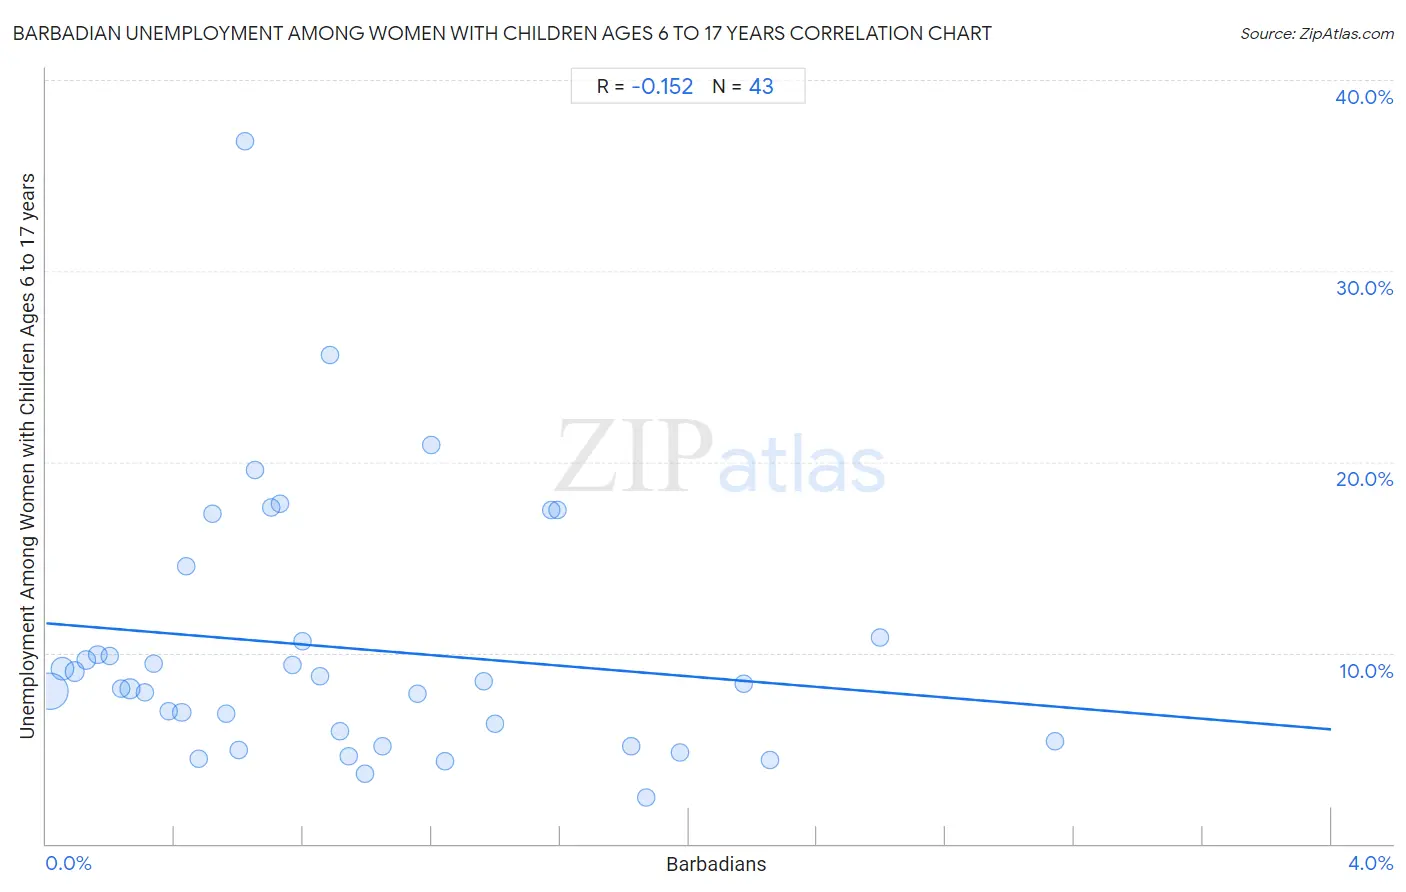
Barbadian Unemployment Among Women with Children Ages 6 to 17 years Correlation Chart
The statistical analysis conducted on geographies consisting of 121,323,299 people shows a poor negative correlation between the proportion of Barbadians and unemployment rate among women with children between the ages 6 and 17 in the United States with a correlation coefficient (R) of -0.152 and weighted average of 8.7%. On average, for every 1% (one percent) increase in Barbadians within a typical geography, there is a decrease of 1.4% in unemployment rate among women with children between the ages 6 and 17.
It is essential to understand that the correlation between the percentage of Barbadians and unemployment rate among women with children between the ages 6 and 17 does not imply a direct cause-and-effect relationship. It remains uncertain whether the presence of Barbadians influences an upward or downward trend in the level of unemployment rate among women with children between the ages 6 and 17 within an area, or if Barbadians simply ended up residing in those areas with higher or lower levels of unemployment rate among women with children between the ages 6 and 17 due to other factors.
Demographics Similar to Barbadians by Unemployment Among Women with Children Ages 6 to 17 years
In terms of unemployment among women with children ages 6 to 17 years, the demographic groups most similar to Barbadians are Hmong (8.7%, a difference of 0.10%), Immigrants from Northern Africa (8.7%, a difference of 0.12%), Czech (8.7%, a difference of 0.12%), Immigrants from Western Asia (8.7%, a difference of 0.14%), and South African (8.7%, a difference of 0.15%).
| Demographics | Rating | Rank | Unemployment Among Women with Children Ages 6 to 17 years |
| Immigrants from Egypt | 95.0 /100 | #122 | Exceptional 8.7% |
| Immigrants from Morocco | 94.9 /100 | #123 | Exceptional 8.7% |
| Immigrants from Lebanon | 94.9 /100 | #124 | Exceptional 8.7% |
| South Africans | 94.6 /100 | #125 | Exceptional 8.7% |
| Immigrants from Northern Africa | 94.4 /100 | #126 | Exceptional 8.7% |
| Czechs | 94.4 /100 | #127 | Exceptional 8.7% |
| Hmong | 94.3 /100 | #128 | Exceptional 8.7% |
| Barbadians | 93.8 /100 | #129 | Exceptional 8.7% |
| Immigrants from Western Asia | 93.1 /100 | #130 | Exceptional 8.7% |
| Slavs | 92.2 /100 | #131 | Exceptional 8.7% |
| Yaqui | 92.2 /100 | #132 | Exceptional 8.7% |
| Egyptians | 91.8 /100 | #133 | Exceptional 8.7% |
| Immigrants from Ireland | 91.0 /100 | #134 | Exceptional 8.7% |
| Europeans | 90.6 /100 | #135 | Exceptional 8.7% |
| Immigrants from Latvia | 90.4 /100 | #136 | Exceptional 8.7% |
Barbadian Unemployment Among Women with Children Ages 6 to 17 years Correlation Summary
| Measurement | Barbadian Data | Unemployment Among Women with Children Ages 6 to 17 years Data |
| Minimum | 0.012% | 2.4% |
| Maximum | 3.1% | 36.8% |
| Range | 3.1% | 34.4% |
| Mean | 0.94% | 10.2% |
| Median | 0.77% | 8.4% |
| Interquartile 25% (IQ1) | 0.38% | 5.4% |
| Interquartile 75% (IQ3) | 1.4% | 10.8% |
| Interquartile Range (IQR) | 0.98% | 5.4% |
| Standard Deviation (Sample) | 0.74% | 6.7% |
| Standard Deviation (Population) | 0.73% | 6.7% |
Correlation Details
| Barbadian Percentile | Sample Size | Unemployment Among Women with Children Ages 6 to 17 years |
[ 0.0% - 0.5% ] 0.012% | 69,887,836 | 8.0% |
[ 0.0% - 0.5% ] 0.052% | 19,201,498 | 9.2% |
[ 0.0% - 0.5% ] 0.088% | 6,959,818 | 9.0% |
[ 0.0% - 0.5% ] 0.12% | 4,541,933 | 9.6% |
[ 0.0% - 0.5% ] 0.16% | 2,580,816 | 9.9% |
[ 0.0% - 0.5% ] 0.20% | 2,020,205 | 9.8% |
[ 0.0% - 0.5% ] 0.23% | 1,031,264 | 8.1% |
[ 0.0% - 0.5% ] 0.26% | 9,303,874 | 8.1% |
[ 0.0% - 0.5% ] 0.31% | 1,041,181 | 7.9% |
[ 0.0% - 0.5% ] 0.34% | 753,634 | 9.5% |
[ 0.0% - 0.5% ] 0.38% | 388,574 | 7.0% |
[ 0.0% - 0.5% ] 0.42% | 954,744 | 6.9% |
[ 0.0% - 0.5% ] 0.44% | 215,495 | 14.5% |
[ 0.0% - 0.5% ] 0.48% | 79,351 | 4.4% |
[ 0.5% - 1.0% ] 0.52% | 180,033 | 17.3% |
[ 0.5% - 1.0% ] 0.56% | 247,346 | 6.8% |
[ 0.5% - 1.0% ] 0.60% | 49,381 | 4.9% |
[ 0.5% - 1.0% ] 0.62% | 23,071 | 36.8% |
[ 0.5% - 1.0% ] 0.65% | 6,916 | 19.6% |
[ 0.5% - 1.0% ] 0.70% | 113,711 | 17.6% |
[ 0.5% - 1.0% ] 0.73% | 172,344 | 17.8% |
[ 0.5% - 1.0% ] 0.77% | 161,758 | 9.4% |
[ 0.5% - 1.0% ] 0.80% | 5,397 | 10.6% |
[ 0.5% - 1.0% ] 0.85% | 160,227 | 8.8% |
[ 0.5% - 1.0% ] 0.88% | 40,795 | 25.6% |
[ 0.5% - 1.0% ] 0.92% | 258,069 | 5.9% |
[ 0.5% - 1.0% ] 0.94% | 72,335 | 4.6% |
[ 0.5% - 1.0% ] 0.99% | 80,567 | 3.7% |
[ 1.0% - 1.5% ] 1.05% | 29,820 | 5.1% |
[ 1.0% - 1.5% ] 1.16% | 181,212 | 7.9% |
[ 1.0% - 1.5% ] 1.20% | 83,125 | 20.9% |
[ 1.0% - 1.5% ] 1.24% | 27,996 | 4.3% |
[ 1.0% - 1.5% ] 1.36% | 69,131 | 8.5% |
[ 1.0% - 1.5% ] 1.40% | 58,476 | 6.3% |
[ 1.5% - 2.0% ] 1.57% | 10,631 | 17.5% |
[ 1.5% - 2.0% ] 1.59% | 10,482 | 17.5% |
[ 1.5% - 2.0% ] 1.82% | 24,044 | 5.1% |
[ 1.5% - 2.0% ] 1.87% | 24,994 | 2.4% |
[ 1.5% - 2.0% ] 1.97% | 78,506 | 4.8% |
[ 2.0% - 2.5% ] 2.17% | 55,336 | 8.4% |
[ 2.0% - 2.5% ] 2.25% | 100,082 | 4.4% |
[ 2.5% - 3.0% ] 2.60% | 14,172 | 10.8% |
[ 3.0% - 3.5% ] 3.14% | 23,119 | 5.4% |